The following walkthroughs demonstrate how to build a KPI and then how to use the KPIs in Discover.
Examples
Building a KPI
See how to create a growth percentage KPI following the steps below:
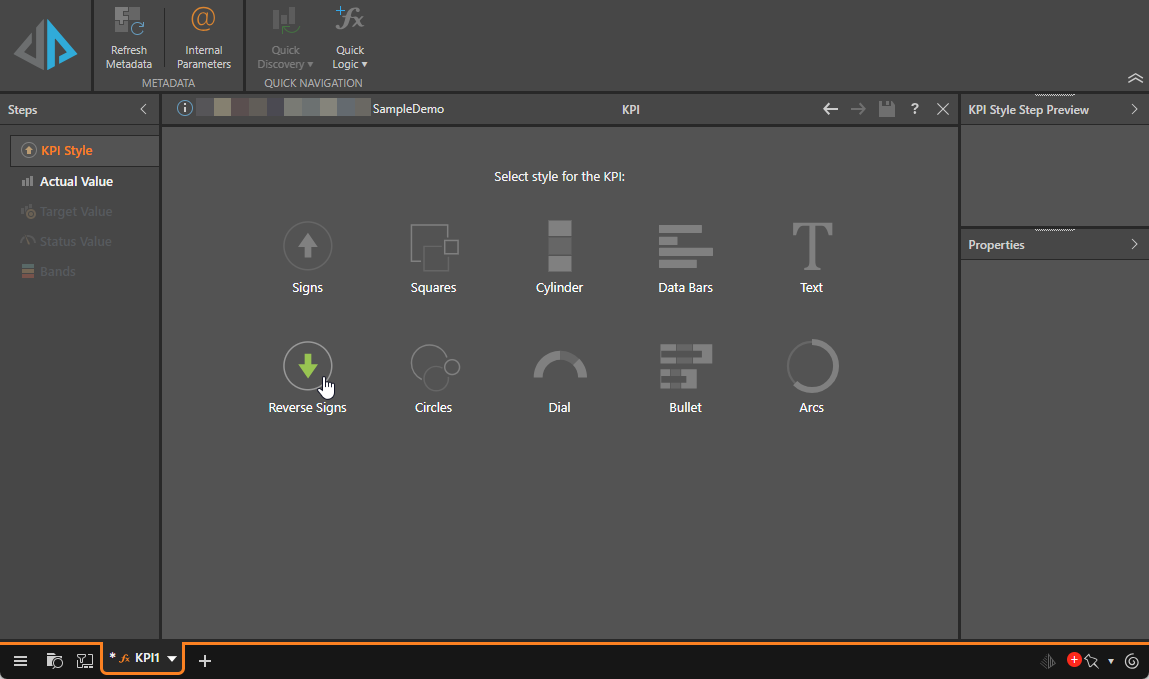
Step 1: KPI Style
Select one of the visual styles from the KPI Style page. For this example, select Reverse Signs. When using arrow indicators:
- Select Signs if you want the status value to be lower than the target value; for example, if your status value is returns, and the target is sales, then a low status value would indicate success.
- Select Reversed Signs if you want the status value to be higher than the target value; for example, if you want a status value of Sales to exceed a target value of Costs.
For information about other indicators, see Gauge Indicator Types.
Next, click the next item in the Steps list: Actual Value.
Tip: To move to the next step, you will need to click the next tab in the left-hand Steps panel. For example, to move onto Step 2 in this process, you need to click Actual Value.
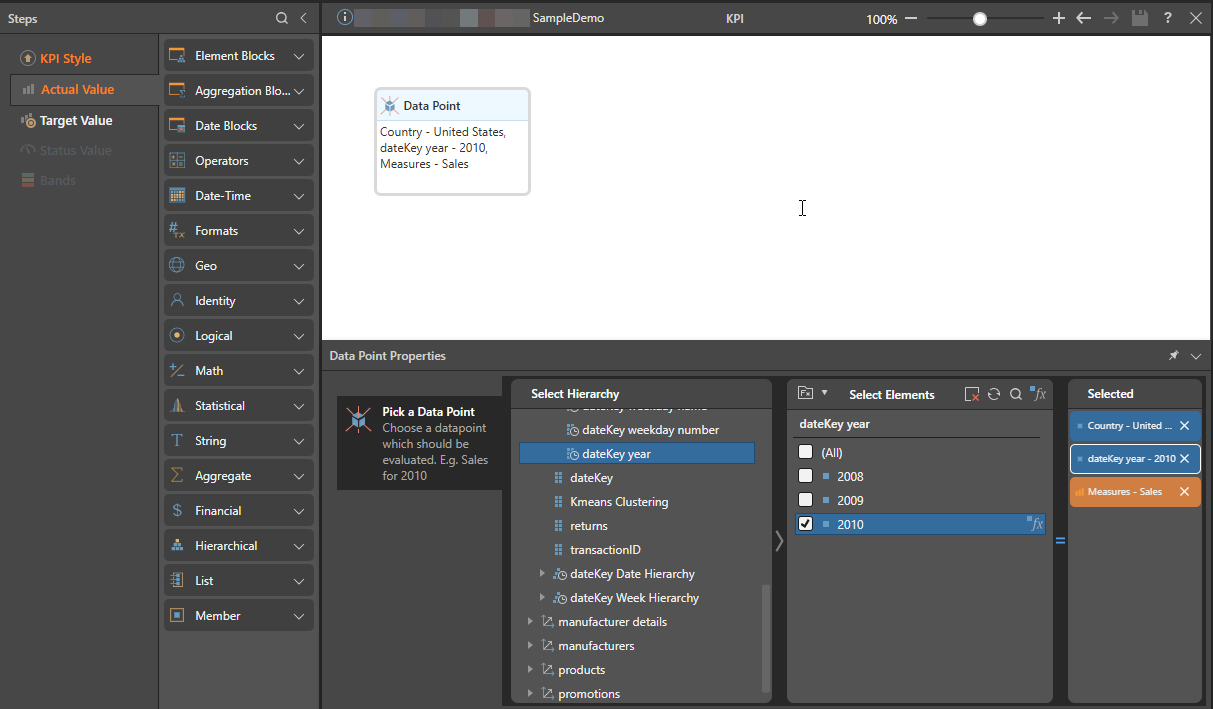
Step 2: Actual Value
Define the Actual Value. This is the value you intend to measure. This may be a data point, member, or set, or you can use the other available functions to define a more complex value.
For this example, the Target Value is US sales for the year 2010.
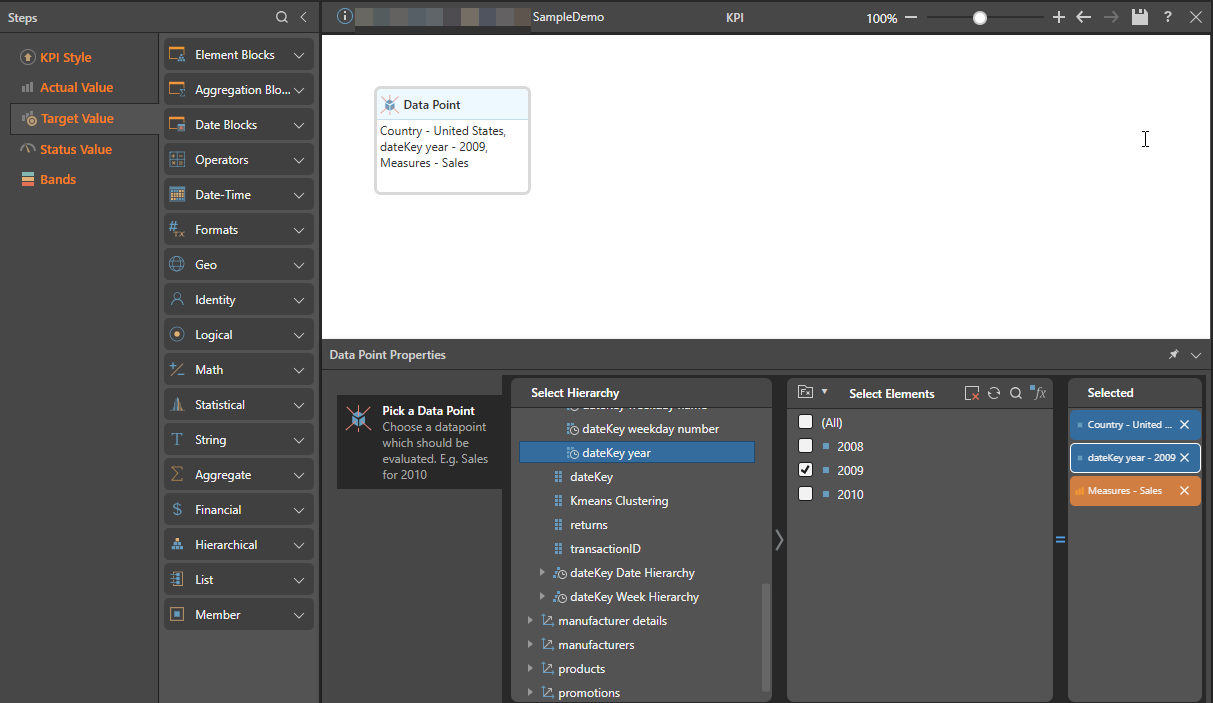
Step 3: Target Value
Specify a target value. This is the your goal that you want to measure your actual value against. Your target value can be a static predefined KPI, or it can be a dynamic value or calculation.
For this example, the Target Value is US sales for the previous year.
Tip: You can use the Copy Actual Fx button in the overhead ribbon to copy the Data Point block from the Actual Value to the Target Value and then just update the date.
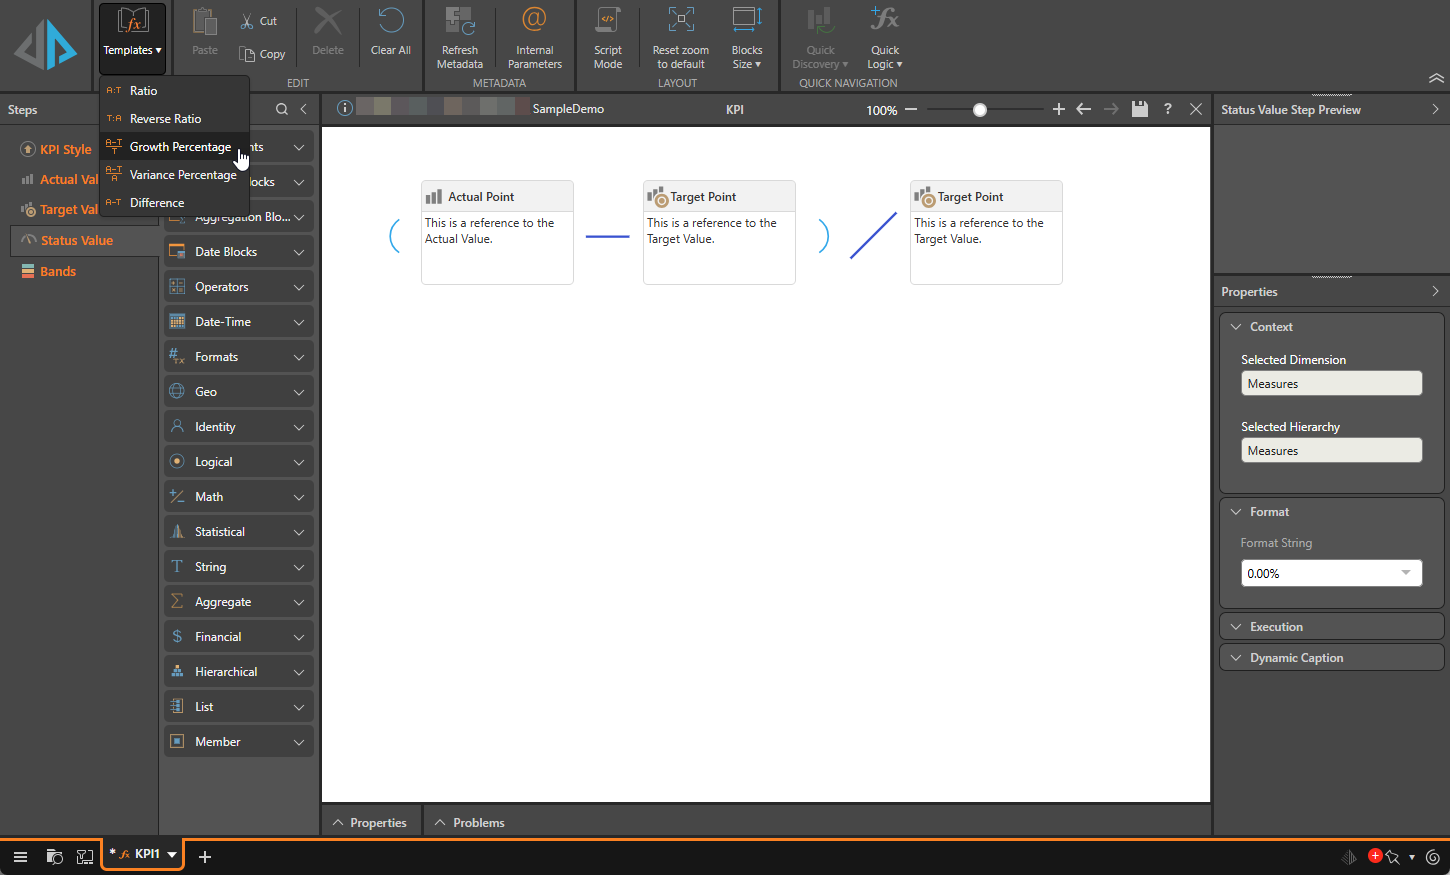
Step 4: Status Value
Add a status value. The status value is the calculation you want to apply to your Actual and Target values, to determine how the actual will be compared with the target. You can define your own calculation, or use the Templates option in the overhead ribbon.
For this example, select Templates > Growth Percentage.
![]() Click Run to test your calculation, and then Save.
Click Run to test your calculation, and then Save.
Step 5: Bands
Enable custom dynamic bands if needed. For information about dynamic bands, click here.
Using a KPI
Once you've saved your KPI, you can add it to queries in Discover:
Step 1
Under Measures, click the Show Business Logic button (orange highlight below). The folder tree appears in the lower window.
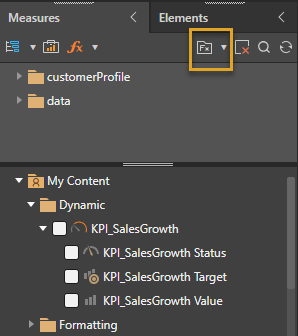
Step 2
Find the KPI in its folder location (blue highlight above), and select it to add it to the query. Each of the KPIs values (actual, target, and status) are added to the drop zones:
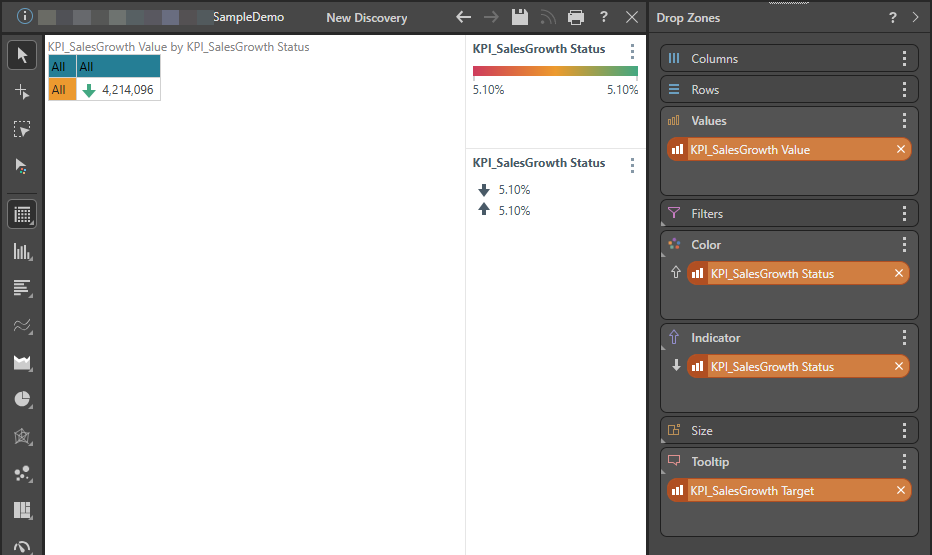
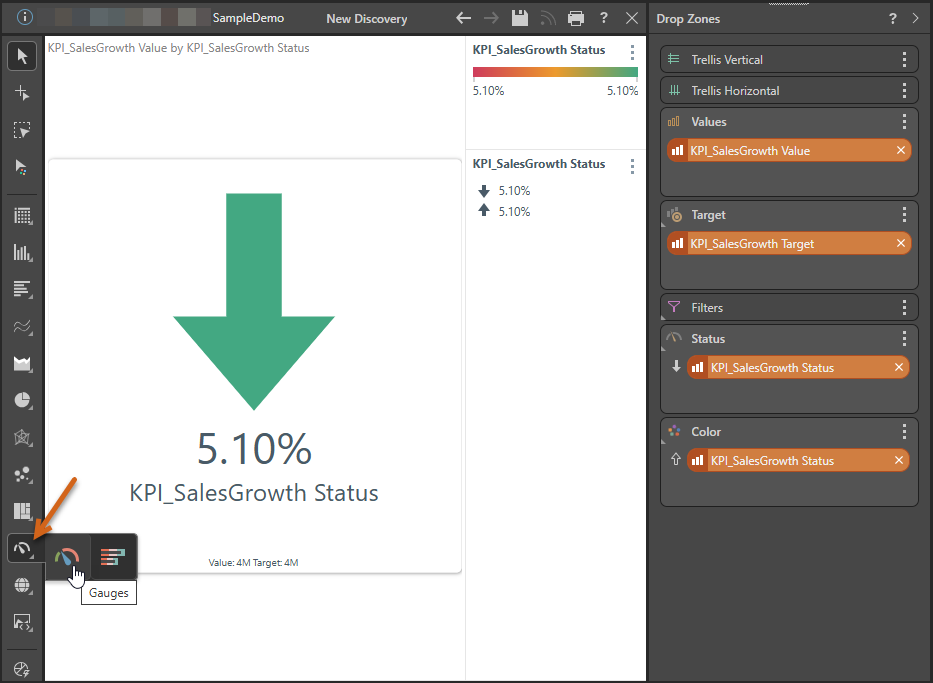
Step 3
Select the required visualization; here, a the KPI is visualized as a gauge.
Step 5
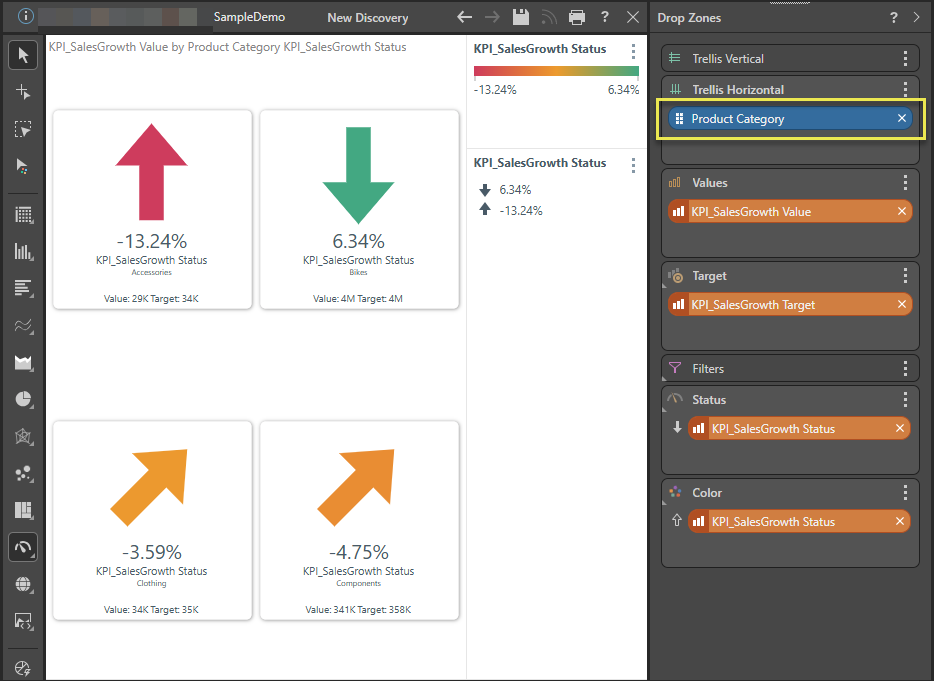
Continue adding to the query as required.
As usual, select the required visualization, including gauges. To learn about gauges click here.
Other Options
- Select KPI values: you can only select specific values from your KPI. For instance, select the Status to see only the status indicator without numeric values.
- Status indicator: move the Status chip over the Indicator icon to see additional indicator options. You can drop the chip onto a different indicator style or indicator logic.
- Drop zones: you can move the KPI chips between the drop zones to see your information differently. For example, move the Values chip from Tooltip to Columns, to see the target value in the grid.
- Color zone: move the Color chip into the Color submenus to change the color indicators and color logic.
Conditional Formatting Dialog: use the advanced dialog to fully customize the KPI banding. Click here to learn more.