Cross-highlighting allows users to select hierarchies or member elements in one discovery to highlight those same items in other discoveries. Selecting a hierarchy or element in a source discovery highlights exactly the same hierarchy or element in any target discovery that is connected by a highlighting interaction. This is sometimes referred to as linking or highlighting.
Note: If the target discovery doesn't contain the selected hierarchy or element, the source selection is used to filter the target instead of highlighting it. For more information, see Cross-Filtering at Runtime.
The following screen capture shows cross-highlighting between multiple visuals:
Note: In the preceding example, multi-highlight mode was enabled. Three members were selected from the grid to cross-highlight the other visuals, then both members in the doughnut chart were used to cross-highlight the other visuals. Lastly, multi-highlight mode was disabled.
Scope of cross-highlighting interactions
Highlight interactions enable cross-highlighting between visuals when clicking on a data point or member element. If the selected data point or member element exists in both visuals, a highlighting effect is applied.
- Cross-highlighting is the default interaction type where an interaction is added between discoveries.
- If the selected source data point or member element doesn't exist in the target visual, the target visual is cross-filtered instead of being cross-highlighted. For more information, see Cross-Filtering at Runtime.
- You can cross-highlight by multiple data points using any of the multi-select options. This includes Lasso tools,
Ctrl+click, and the Multi-highlight mode (selected from the Present runtime menu). For more information, see Multi-select highlighting at Present Runtime. - Cross-highlighting may apply across your presentation where your presentation designer has added targets to enable cross-slide interactions. Note that the effect is identical to cross-highlighting within a slide, the only difference being that the source and target visuals appear in different slides.
Example: Highlight Promotion Types
To highlight hierarchies or member elements in multiple discoveries on a slide at runtime:
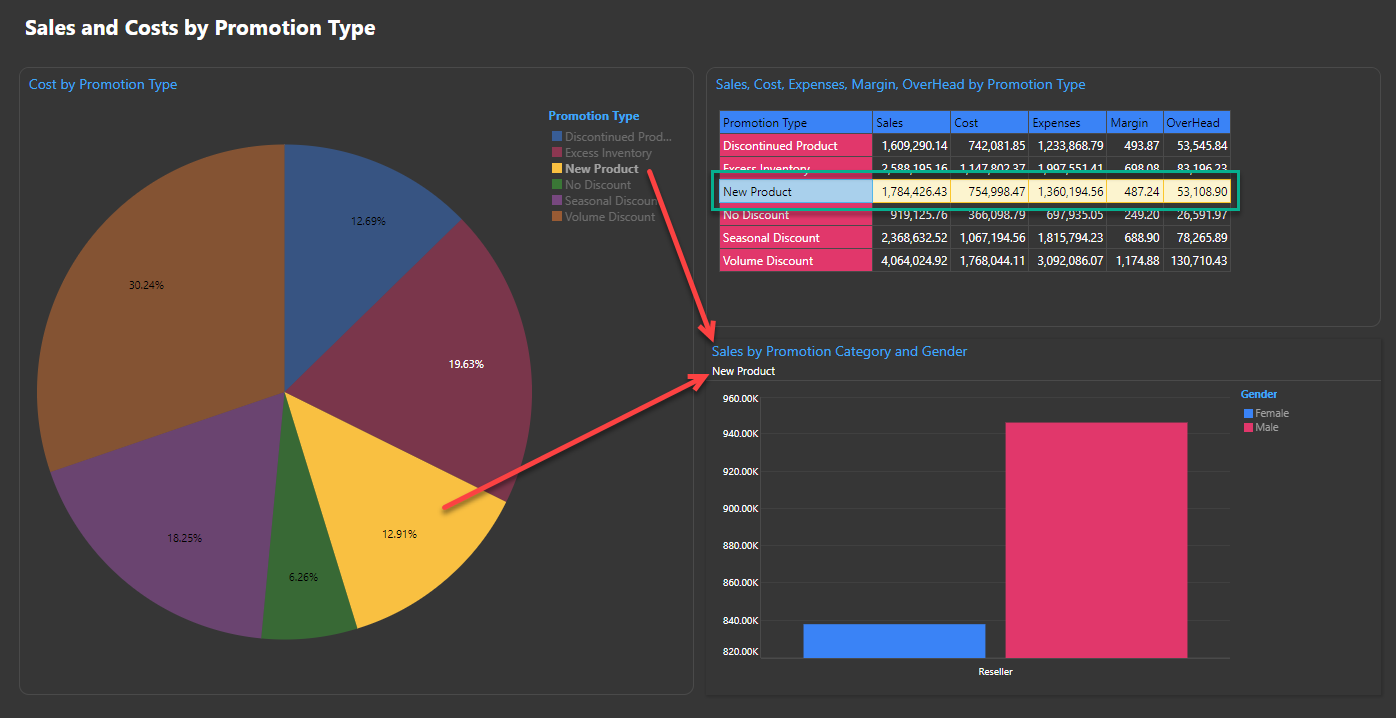
- Select the hierarchy or member element in the source discovery that you want to highlight in the target discovery. In the example case, select the New Product:
- In the Pie Chart, select a "slice" of the pie or the item in the Legend representing the same item. In either case, the New Product row is highlighted in the Grid (red arrows).
- In the Grid, (green highlight) select either a whole row (using the row name) or any one of its values. The New Product options are highlighted in the Pie Chart.
- Along with the two preceding interactions, there is also a column chart in the bottom right. This chart also has interactions with the other visuals, but does not show the same items. The column chart is, therefore, filtered and not highlighted by the selected item (for more information, see Cross-Filtering at Runtime).
- Select an additional hierarchy or member element by holding down
CTRLand clicking another slice, legend, row, or cell. This selected item is now also highlighted both in the discovery where you selected it and in the other discovery or discoveries.
Note: There are several mechanisms for selecting multiple hierarchies or member elements. For more information, see Multi-select highlighting at Present Runtime.
Note: The preceding process assumes that a standard Single click / touch selection in your User Defaults is set to Highlight. If not, you can use right-click Data Interactions > Interact to perform the same highlighting task.