Add existing analytic content (Discover visuals or Tabulate visual areas) to your publication from the content management system or by dragging open items in from the App Tabs. These content items were typically created by you or your colleagues using Discover or Tabulate and saved to a shared location; reusing them in this publication ensures that you are always including the latest underlying analytic data from your team.
As an alternative, you might want to create and add brand new "one-off" visuals that only exist within this publication. For more information, see:
- Creating Visuals using Discover Lite in Publish Pro.
- Creating Visuals using Smart Reporting in Publish Pro.
Note: You must have sufficient rights to access the visuals in the content management system to be able to see them in the Content Manager and add them to your publication. For more information, see Content Folder Structures.
Adding existing visuals
Before you begin
If you want to add visuals from the content management system, you or your colleagues need to have already created and saved them in advance of this task. To be available in the Content panel, the saved visuals must be available in the content tree in locations that you have access to. The content items may include existing:
- Visuals, created in Discover.
- Visual areas, defined in a Tabulate spreadsheet. Note: You cannot add a whole spreadsheet to your publication, only specific visual areas.
- Infographics, created in Illustrate.
- Parameters, created in Formulate.
You also need to have created the publication that you want to add your visual to. For details, see Building a New Document in Publish Pro.
Step 1: Select a page
Before you begin, you need to open the page that you want to add your visual to. This may be a page that already exists in your publication or a new page created for the visual.
From the Pages panel:
- Select the relevant snapshot.
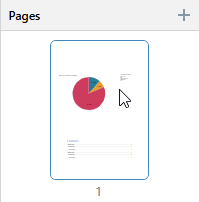
The selected page is highlighted in the Pages panel and opens on the canvas for editing.
Tip: You can also add a new page by clicking the Plus (+) icon at the top-right of the Pages panel.
The page opens on the canvas.
Step 2: Add your visual
Add a visual from the Content panel
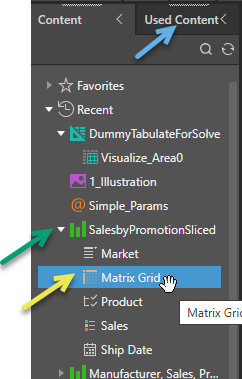
- From the left-hand Content panel, search for or navigate to your visual:
- Do one of the following:
- Drag the whole content item (green arrow) from the content tree onto your canvas.
- Open the submenu and drag one of the sub-content items (yellow arrow) from the content tree onto your canvas. Note that the sub-content items are those items within the visual; such as the grid itself, legends, or slicers. The icon indicates which of these item types you have selected.
The visual is drawn on the canvas.
Note: Since slicers are not "visualized" in publications, dragging them onto the canvas opens the Interaction Manager for configuration. For more information about adding slicers in this way, see Add Existing Slicers in Publish Pro.
Tip: If your visual is used on a separate page of this publication, you can add it from the Used Content panel (blue arrow) instead.
Add an open visual from the App tabs
Note: You can only add a visual to your publication following these steps if the visual has already been saved to the content management system.
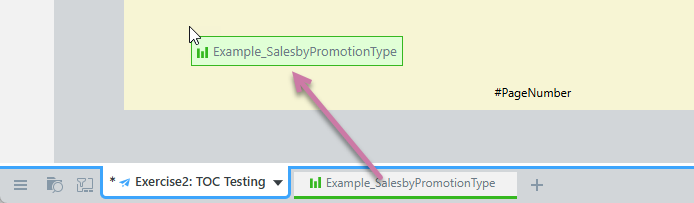
From the App tabs along the bottom of your page:
- Select the tab that represents the visual you want to add, and drag it onto the publication:
What next?
Once you have added your visual, you might want to:
- Resize your visual: Select the panel and drag its handles to fit the space.
- Rename your visual: Right-click the panel, select Rename Title, and supply a new title.
You might also want to add additional content items to the canvas, including additional visuals, text, shapes, images, and so on.
Other tools
You might want to open your visual in Discover, Illustrate, or Tabulate to update it. Given the appropriate access rights, you can do this using the Open options on the right-click context menu.
Overriding existing slicers
If a visual includes its own slicer (typically added during creation in Discover or Smart Reporting), its default filter is preserved when added to a publication. For example, a pie chart filtered by Manufacturer will retain the original selection (say, ACME). To override this selection, add a new slicer with the same data hierarchy to the publication and create an interaction between the visual and the new slicer. For more information, see Managing Slicers in Publish Pro.