If you have large grids or vertically trellised charts in your publication, you can either accept the default handling of the large visuals (where the content is re-sized to fit the page) or you can make use of the Flow Visual function to display them across multiple publication pages. The Flow Visual function ensures that you do not "lose" any content in your final publication, allowing the grid or chart to flow across multiple pages.
It's important to note the limitations of the default resize function so that you can select the best solution for your publication; for example, if your trellised charts exceed a single page, the resize function may mean that the remaining charts in the visual are not seen in the publication, whereas a flow will just add more pages to accommodate more trellised items. Also, scaling a very large grid to fit the page may make it difficult or even impossible to read the grid's contents, whereas a flow may stop the content from resizing.
Tip: If you are also creating presentations containing the same visuals, you can resolve this issue by making the runtime view scrollable.
Note: Flow Visuals are available with Enterprise licensing only.
What are Flow Visuals?
The Flow Visual function is used to display large grids or vertically trellised charts across multiple publication pages. This ensures you do not lose any data to automatic resizing and helps you to design your visual in a way that is maintainable going forwards.
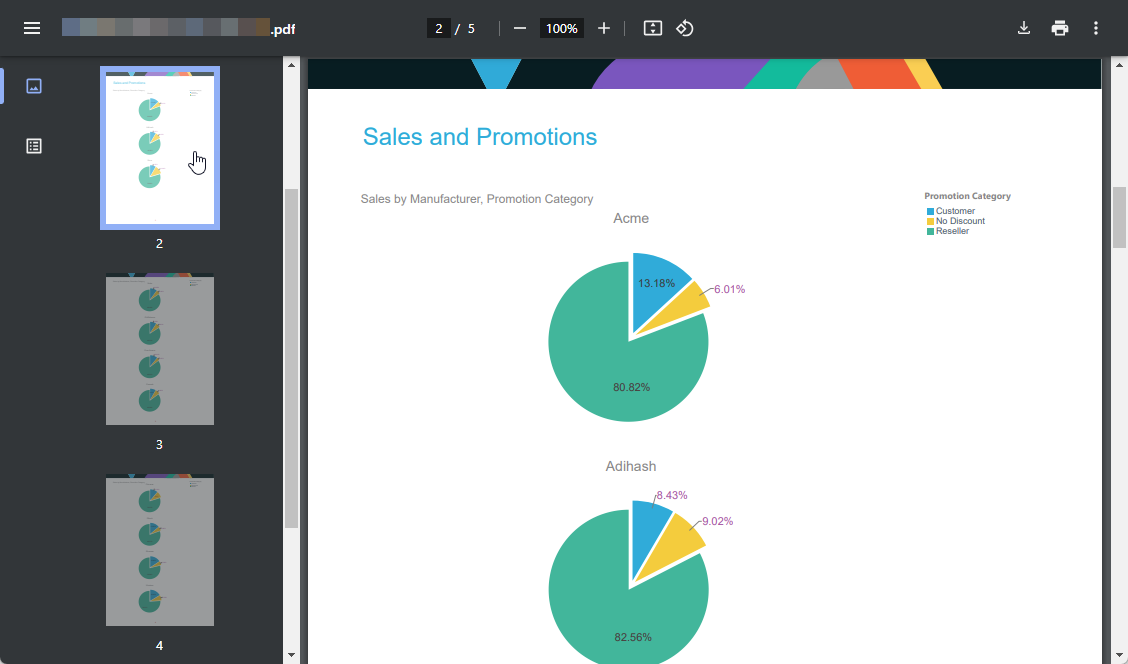
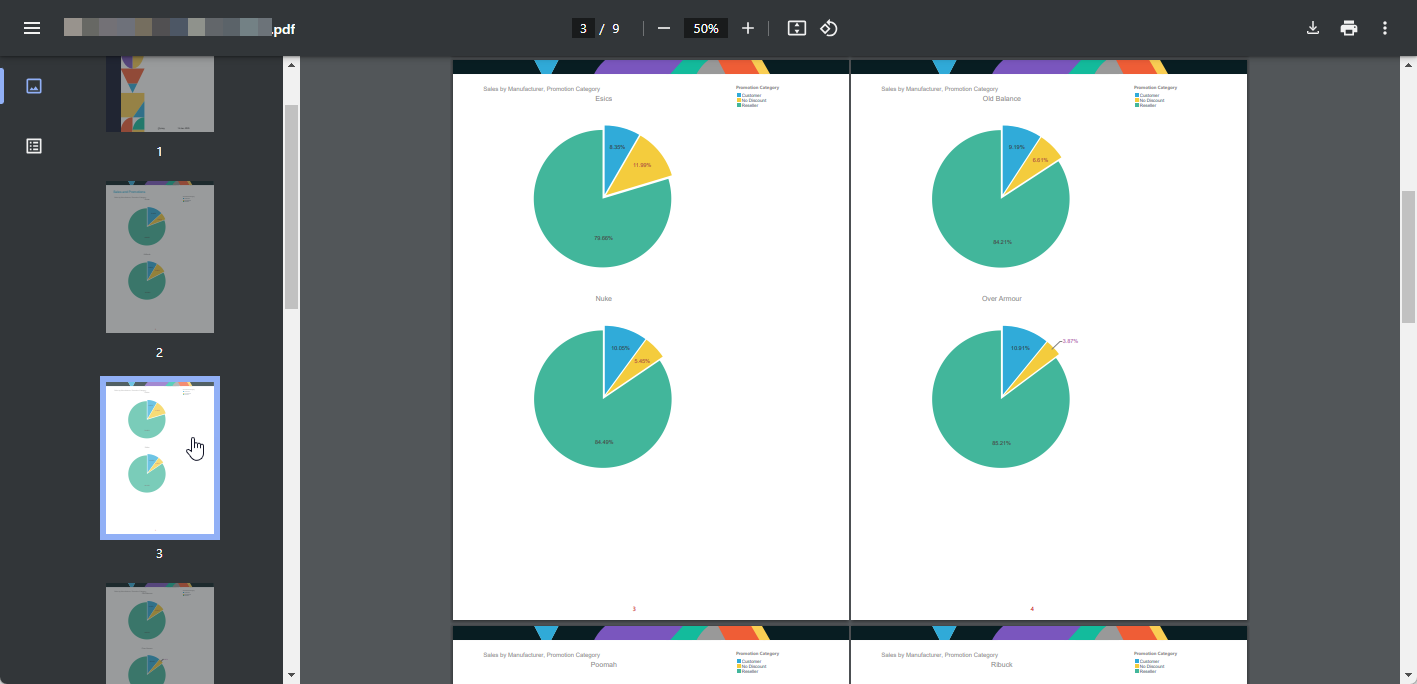
Note: The preceding example shows a visual containing vertically trellised pie charts. In this case, Flow Visual is used to allow Pyramid to decide how many pages are needed to show all the pies. In the source, there is one page containing the visual, but, because of the Flow Visual, there are three pages in the output PDF.
Configuring Flow Visuals
Enabling a Flow Visual
The Flow Visual function is found on the Component ribbon; make sure the visual is selected on the canvas to enable the function:
- Click Flow Visual to make selected visual into a Flow Visual.
Pink margins are shown at the top and bottom of the page, the visual's border displays in pink, and the Flow Visual icon appears in the top-right corner of the visualization. You can adjust the margins of your Flow Visual to set the height for each page in the rendered report.
Configuring your Flow Visual
Flow Visual Button

With the Flow Visual functionality enabled, click Flow Visual to expand the grid to fit the length of the page.
Flow Visual Settings
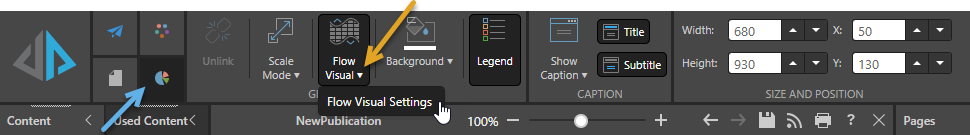
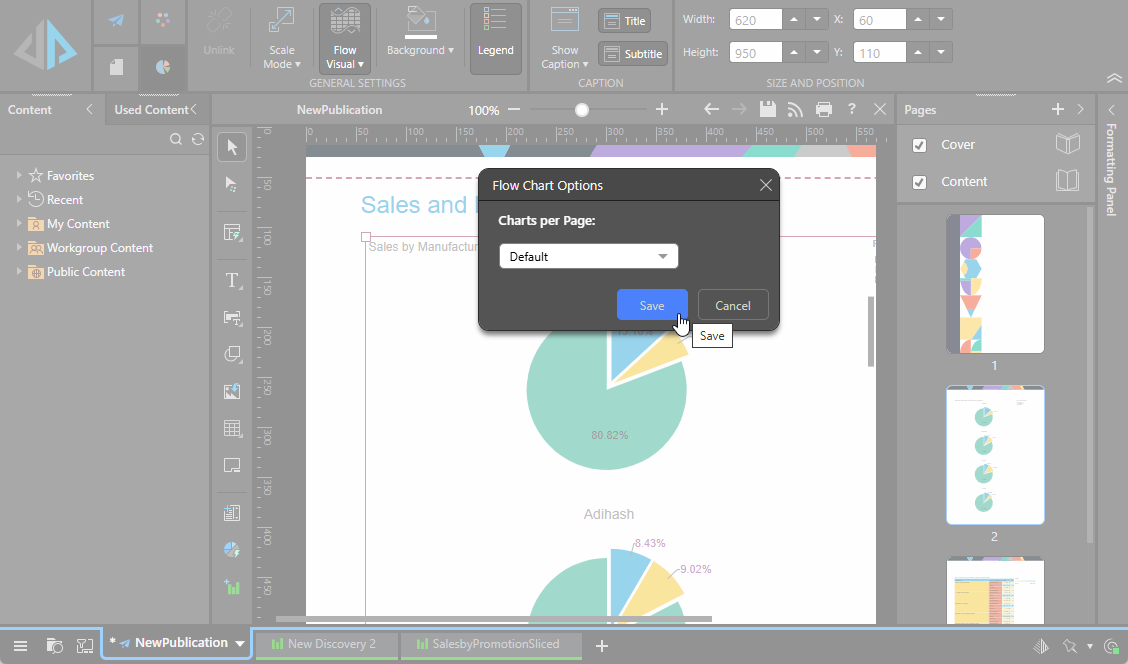
Select the visual and from the Component ribbon:
- Click Flow Visual > Flow Visual Settings to open the Flow Grid Options or Flow Chart Options dialog, where you can configure the settings for your Flow Visual.
The Flow Grid Options dialog determines the settings for the Flow Visual in the rendered report. Its content differs depending on the selected visual type:
- Grids: You can configure whether to show row headers in the grid on each subsequent page following the first page.
- Trellised Charts: You can set the height of each chart row or the number of chart rows per page. This determines the number of pages that the charts will flow over.
Flow Grid Options
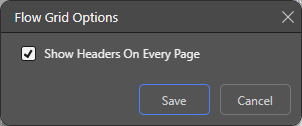
For grids, clicking Flow Visual > Flow Visual Settings opens the Flow Grid Options dialog:
- Select the Show Headers on Every Page checkbox to repeat the grid's row headers on every page of the output Flow Visual.
Tip: Use the options in the Grid Sizing dropdown list to set the width of the grid's rows and columns inside your Flow Visual.
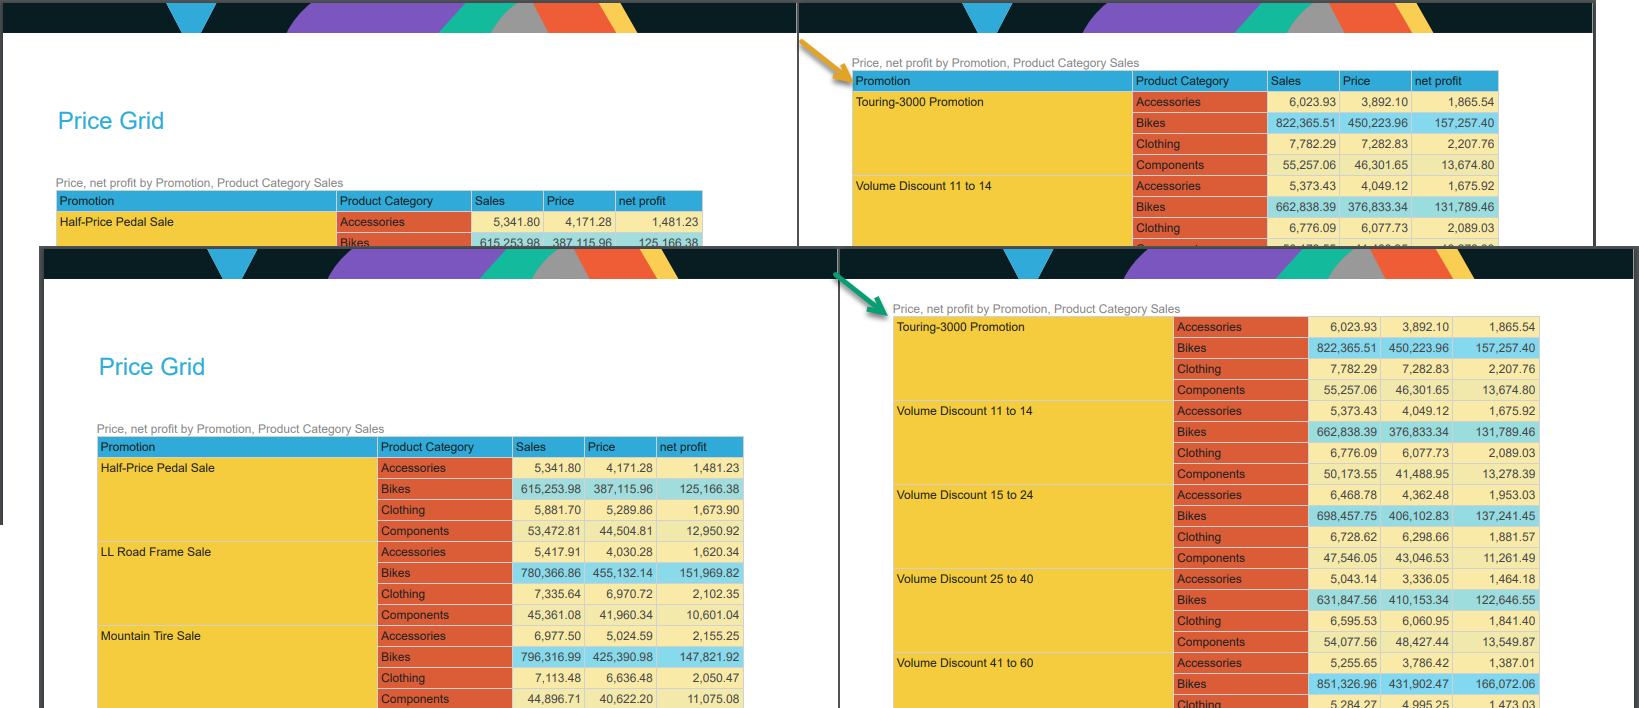
The Show Headers on Every Page option affects the output as follows:
- Where it is selected, the headers for your grid are shown on every page (orange arrow below). This helps you to understand the different pages of data that you see.
- Where it is not selected, the headers for your grid are shown only on the first page (green arrow).
Flow Chart Options
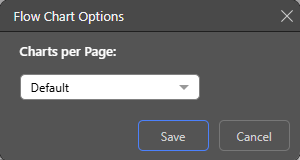
For vertically trellised charts, clicking Flow Visual > Flow Visual Settings opens the Flow Chart Options dialog:
- Select the appropriate option from the Charts per Page dropdown list to indicate how many trellised items should be shown on each page. The options are Default, Row Height per Chart, and Chart Rows per Page.
Default
The Default setting indicates that the height of each chart should be 200 pixels. On a typical A4 page containing only the Flow Visual and using standard margins, the number of chart rows per page will be four.
Note: In the example at the top of this page, this option is selected. Because there is a title on the page containing the Flow Visual, only three charts are shown. On subsequent pages, four charts are shown.
Row Height per Chart
The Row Height per Chart setting sets the chart height in pixels. (The pixels field is enabled when you select the option.) In this case, the height of each trellised chart is equal to the height you've specified, and Pyramid determines the number of chart rows that can fit given your selection.
Chart Rows per Page
The Chart Rows per Page setting indicates the number of chart rows you want to show on each page of the Flow Visual. In this case, Pyramid determines the size of each trellised chart based on the number of chart rows that you specify.
Important: Where custom trellising is applied to trellised charts in Discover, that setting overrides this Chart Rows per Page setting. The row height can still be set to determine chart height for each row of charts.
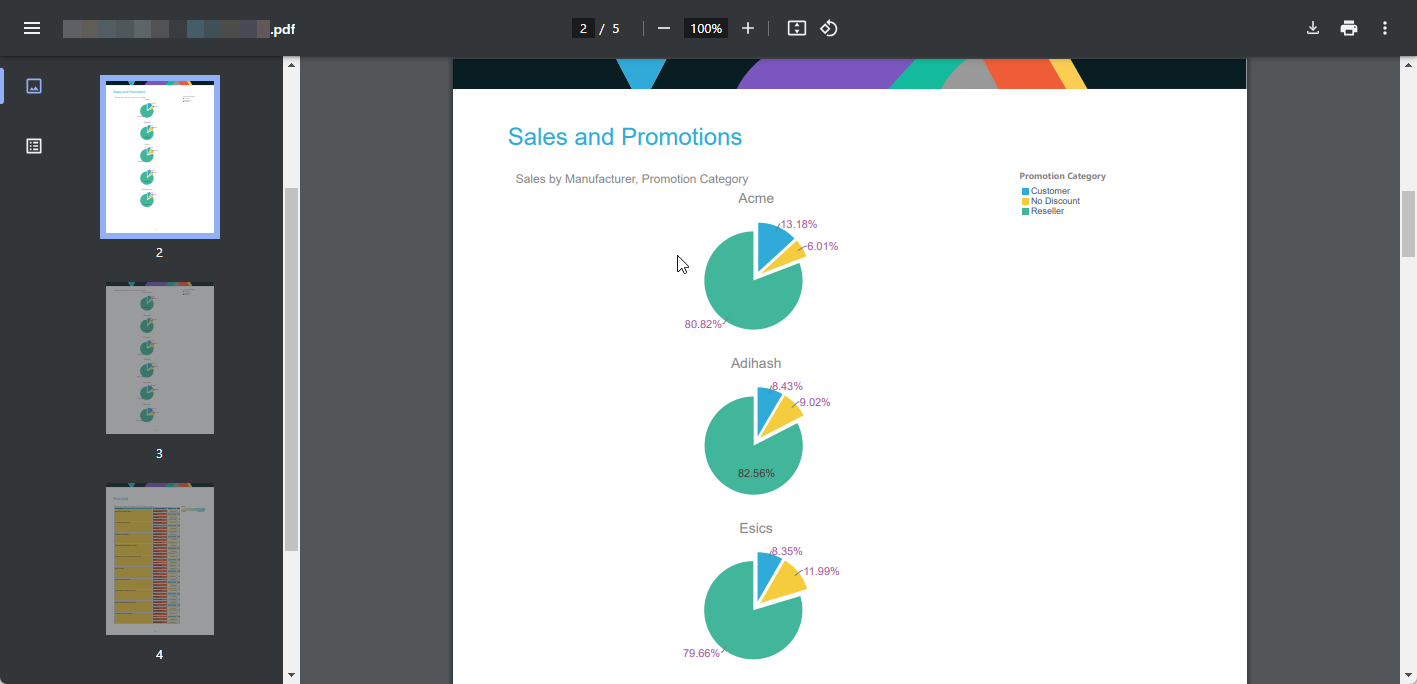
If you set your Charts per Page to Default, Pyramid will set the individual charts to the default size:
In this example, where the page size is A4 and we added a title to our first page, the exported output is as seen in the first example on this page:
- The first page contains three charts, so that it can also accommodate the title.
- The other pages each contain four charts because the default height is 200px and the page size is A4.
In this example, select Row Height per Chart and increase the default height (200 pixels) to 400 pixels, but leave the page size as A4. This is double the default size, so there will typically be half the number of charts on each output page.
When exported, we see each Flow Visual page contains two rows, each of which is 400 pixels:
In this example, select Chart Rows per Page and increase the default (4) to 6, but leave the page size as A4.
When exported, we see each Flow Visual page contains six charts with the charts resized evenly:
Note: Again, the first page is affected by the title. The configuration indicates that six charts should typically be used, but the first page includes only five charts to accommodate the title.