Create a tooltip action that opens a specified visual or presentation as a "graphic tooltip" when you hover over a measure in your visualization. Tip: You can display different tooltips for each measure as per your requirements.
Hovering over the relevant measures, the tooltip opens that displays the corresponding visual. The report displayed in the tooltip is filtered by the hierarchies contained in the current query; this means both reports must come from the same database, or have cross model mapping applied.
Note: If you choose to "include context" in the tooltip, it will also be filtered by any slicers or interactions applied to the current query. Tooltip actions that are applied to a visual will also appear at runtime for presentations containing that query.
Building a Tooltip Action
Tooltip actions can be created from both Discover and Present:
- To create a tooltip that will be seen in both Discovery and in Presentations at runtime, you should create your Tooltip Action in Discover (as described here) or follow the "streamlined" process in Present to create Tooltip Presentations.
- To create a tooltip that opens only in a specific instance of a query, you should create your Tooltip action in Present, following the steps in Tooltip Action.
Tip: In addition to tooltips, there are a number of other Actions that you can use to extend the classic flow of analytics in Discovery. For more information, see Discovery Actions.
Open the Action Panel in Discovery
To open the Action panel, click Actions from the Home ribbon:

The Action panel opens at the bottom of the page.
Creating a Tooltip Action
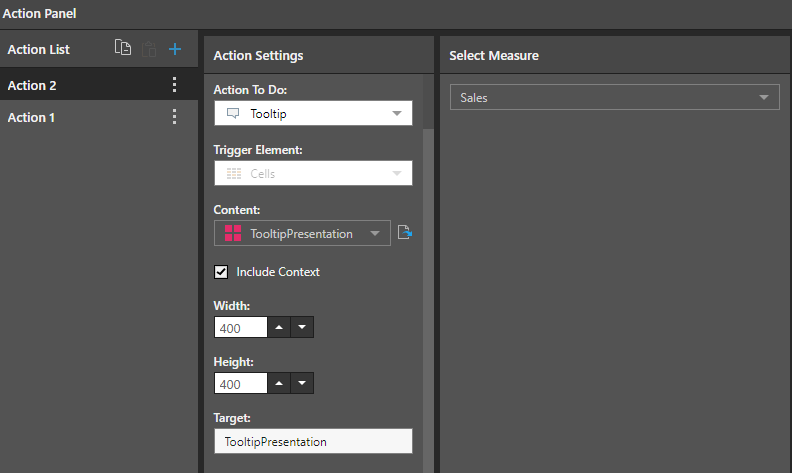
From the Action Panel:
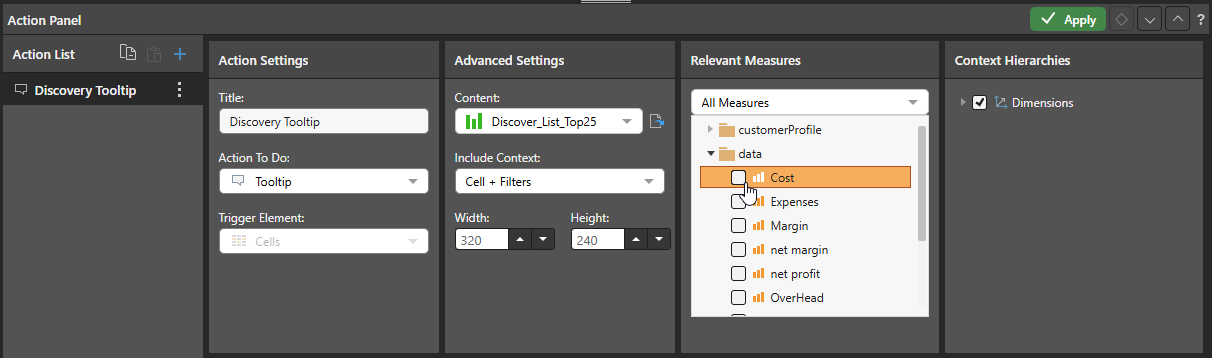
- Set Tooltip as the Action to do.
- Open the Content dropdown list and select the required visual or presentation from the Content tree.
- Optionally, select Cell + Filters from the Include Context dropdown list to filter the report tooltip by slicers and interactions performed in the current query (measures will not be injected into the tooltip).
- Set the Width and Height of the tooltip container as needed.
- Where the content is a presentation and a target is used for the interaction, supply the Target name.
- Choose the Relevant Measure that should drive the tooltip action. When you hover over the selected measure column, the tooltip opens. Note: You can select any single measure or make no selection from the Measure tree to choose All Measures. In the latter case, the tooltip is driven by every measure in the query.
Tooltip Content
The visual tooltip supports the display of discoveries and presentations.
When displaying a presentation in the tooltip, it is recommended to use a "tooltip presentation"; this is a streamlined presentation that is optimized for use as a visual tooltip.
Examples
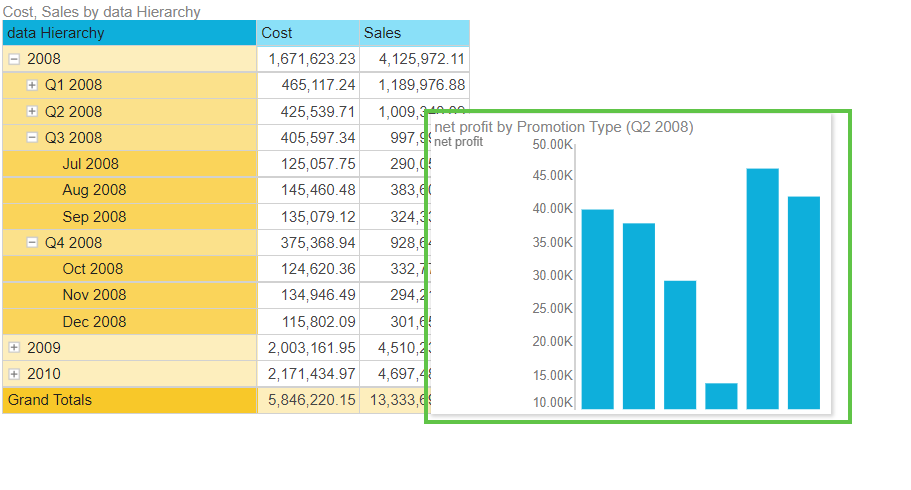
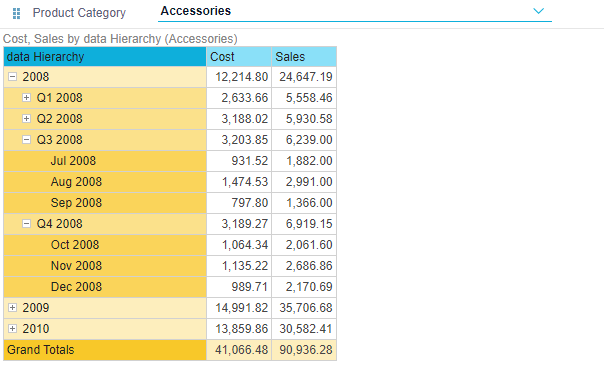
In this example, we have a grid showing Cost and Sales by Date hierarchy and filtered by a Product Category slicer:
A tooltip action was created containing a pie chart, with context included, and driven by all measures in the current query:
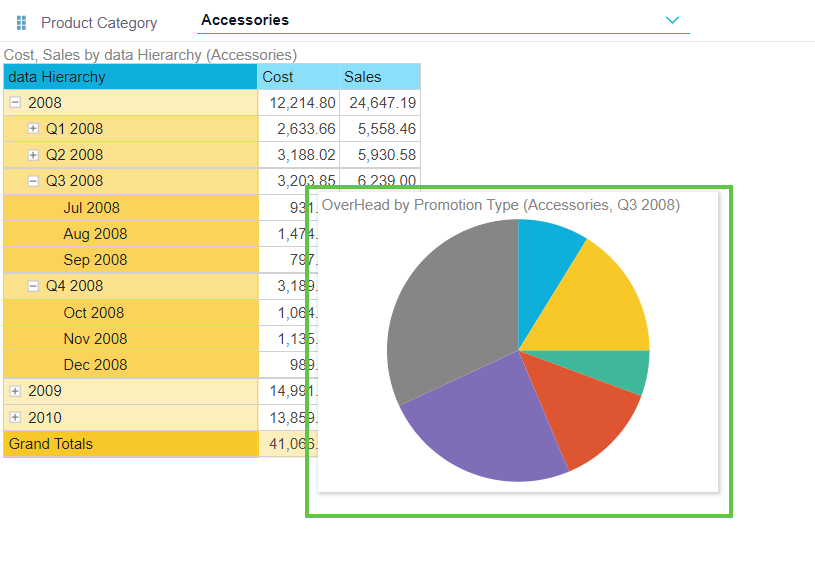
When hovering over the measure columns in the current query, the tooltip appears displaying the selected pie chart. Since Cell + Filters has been selected from Include Context, the tooltip breadcrumbs show that the pie chart is filtered by the current query dimensions: Accessories, Q3 2008:
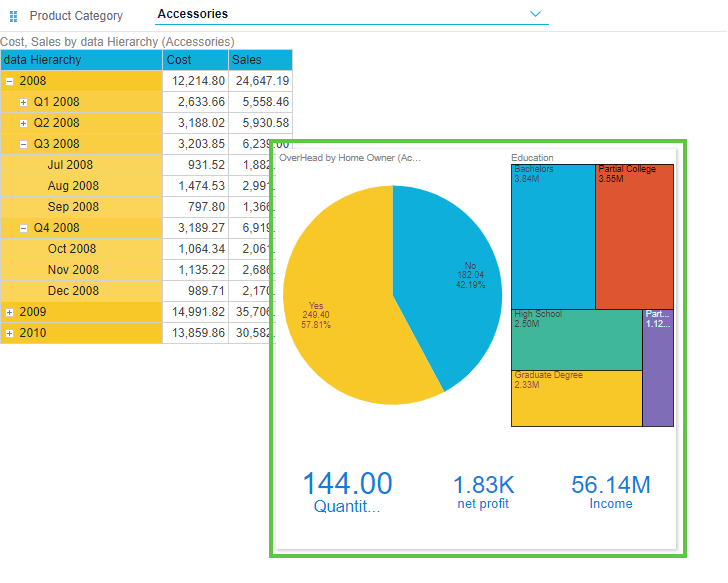
In this example, the same grid is used to drive a tooltip that displays a presentation. The item selected from the content tree is a tooltip presentation optimized for use in a visual tooltip.
The width and height were increased to better display the multiple visuals in the presentation tooltip.
And finally, the target was provided, and the measure set to Sales:
When hovering over the Sales column, the presentation tooltip appears, with its contents filtered by the elements in the grid:
Action Panel fields
Action settings
Title
Name your action. If you want to open your action from the right-click Actions context menu (the default option), you will need to know its name later.
Action to Do
From the Action To Do dropdown list, select Tooltip.
Trigger Element
Cells is the only valid Trigger option for a Tooltip and is selected as a fixed value. It indicates that the action will be available from the cell (data point) level only.
Advanced Settings
Content
Under Content, find and select the required discovery or presentation from the Content tree (orange arrow below):
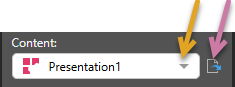
Once you have selected a discovery or presentation, you can click the Open Item button (purple arrow above) to open it in a new tab.
Include Context
Select one of the options from the Include Context dropdown list to determine which context selections from your visual (when it is filtered using slicer selections or query interactions) should be included in your target content item when it is opened using the selected action.
Any Trigger Element
Select None to not include any context. Ignore selections from slicers and do not create any background chips (reflecting query interactions) on the opened content item.
Report or Cells
If your Trigger Element is Report or Cells:
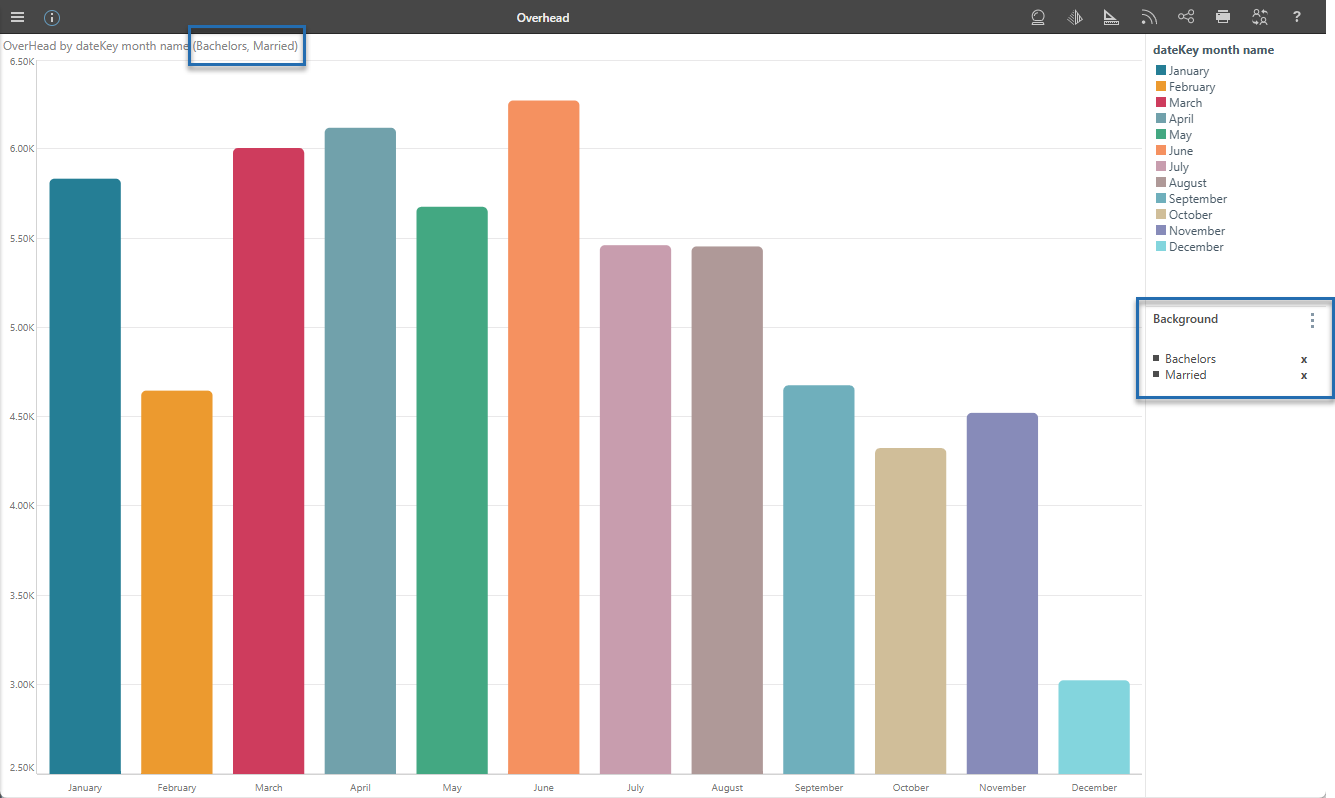
- Cell: Include the context derived from the trigger element. Where the trigger element is Cells, the context reflects the coordinates for the cell (Bachelors, Married).
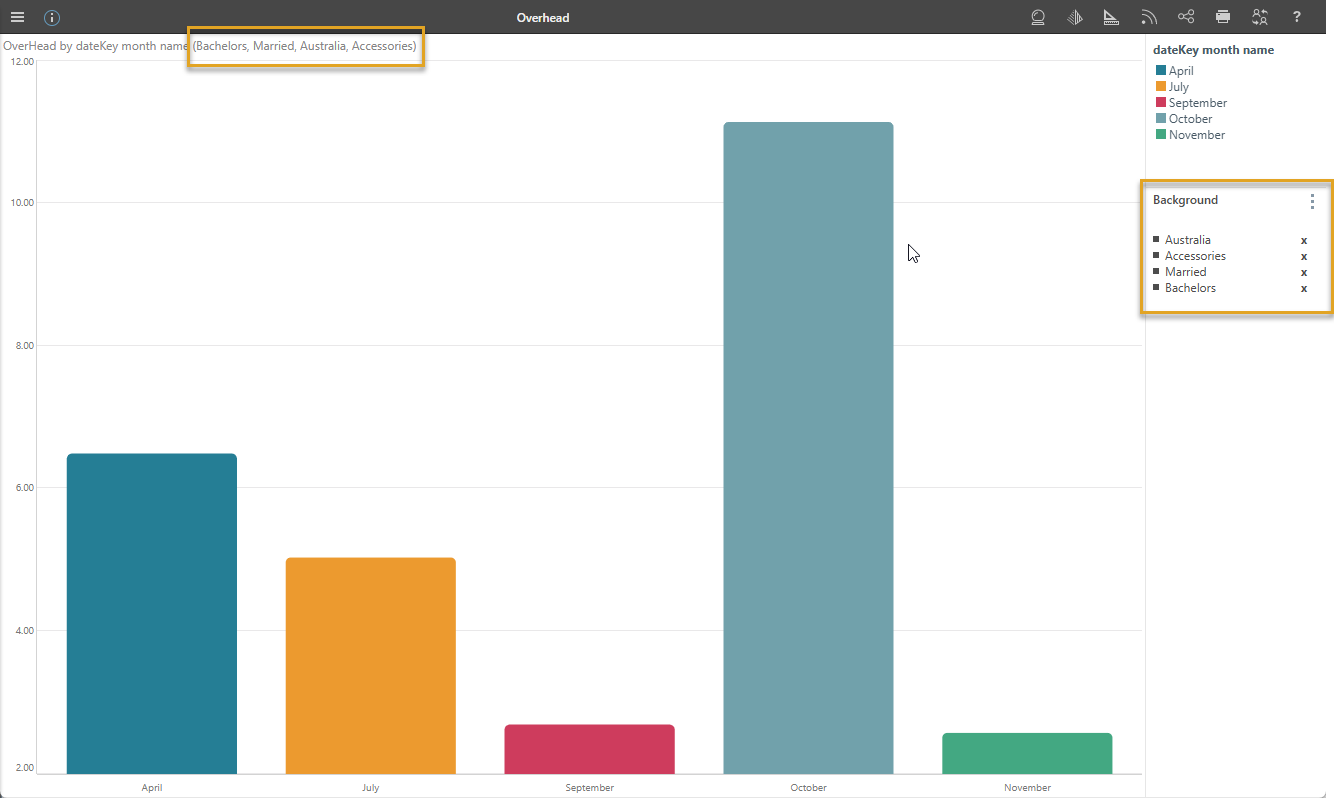
- Cell + Filters: Include both the context derived from the cell (described above) and also the context derived from any filters (Bachelors, Married, Australia, Accessories).
Hierarchy or Member
If your Trigger Element is Hierarchy or Member:
- Select Members to include both the context derived from the selected member and also the context derived from any filters.
The example below demonstrates what happens when you include Cell context in a Jump to Content Item Action. In this case, the action is defined within a runtime presentation. The same behavior occurs in the discovery when opened in Discover if the action is defined there instead.
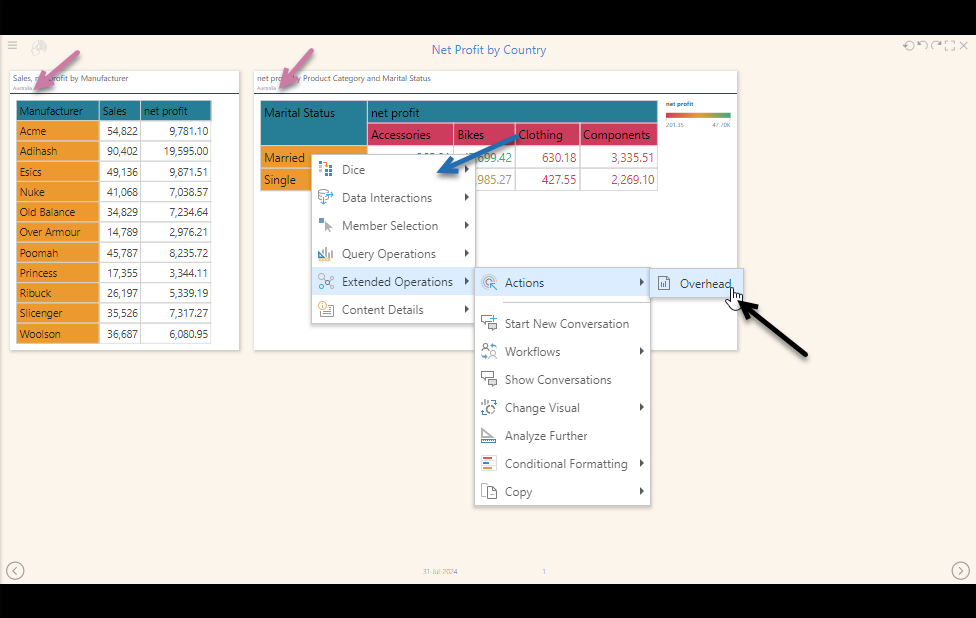
Where your discovery shows net margin by product category as a grid:
- Select a country from the Nation slicer (purple arrow). For example, Australia.
- Use one of the right-click context menu options to perform a query interaction. For example, select Accessories and then Dice > Customer Profile > Education.
- Right-click Extended Operations > Actions > Overhead from the selected cell to open the target visual using the Overhead action.
If Include context is Cell in the Action Settings, then the coordinates from the cell (see blue highlights) are included as context in the target visual opened by the action:
If Include context is Cell + Filter in the Action Settings, then both the cell coordinates and filter context are included in the target visual (see orange highlights):
If Include context is None in the Action Settings, then no cell or filter context information is passed from the source to the target visual. No context filtering is passed from the source to the Your user typically accesses actions through the context menu, which opens with a right-click on a desktop or a long tap on a mobile.
Width and Height
Set the width and height of the tooltip container as needed. This will also determine the size of the report in the tooltip.
Target
Where the Content is a presentation, you can enter the name of the relevant presentation target in the "Target" field.
Relevant Measures
The Relevant Measures tree allows you to limit which measures your Action is relevant to. For example, selecting the Costs measure in this tree could cause the following effects:
- When creating a Tooltip action, the tooltip will only be displayed when you hover over values relating to Cost measures.
- When creating an action that is triggered from the right-click context menu, the action item will only be offered on the context menu where you right-clicked Cost values.
- When creating an action that is triggered using one of the click actions, the action will only be run from a Cost measure.
Basically, this configuration allows you to offer different actions for different measures.
Note: You can only select one measure from the Relevant Measures tree. To clear a previous selection (to return to the default selection of "all measures"), clear the selected checkbox.
Context Hierarchies
Where Cell or Cell + Filter is selected from the Include Context dropdown list, the Context Hierarchies panel also opens. Clear the checkboxes in the tree to exclude any hierarchies that you don't want to include in the context.