The Colorize function applies discrete colors to measures in the query, which is useful for displaying measures in different colors in grids and trellis charts. Enabling the Auto-Colorize function from the Design ribbon automates this process, by automatically 'colorizing' (copying to the Color zone) each measure added to the query.
Enabling Auto-Colorize
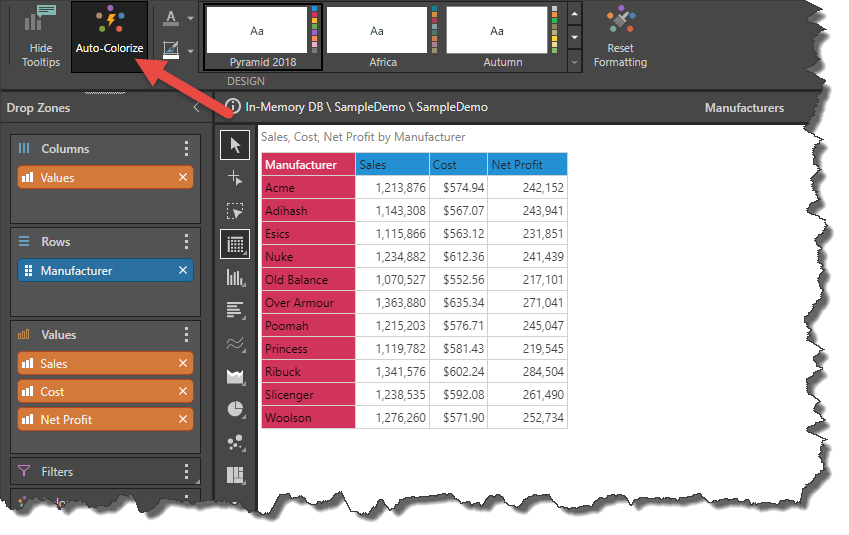
Click Auto-Colorize in the Design ribbon:

Note: If Auto-Colorize is enabled after the measures have been added, they will be colorized only when a change is made to the Values zone; for example, by adding or removing a measure.
Example
In this example, Auto-Colorize was enabled (red arrow) only after Sales, Cost, and Net Profit were added to the query. The columns in the grid are, therefore, not colorized:
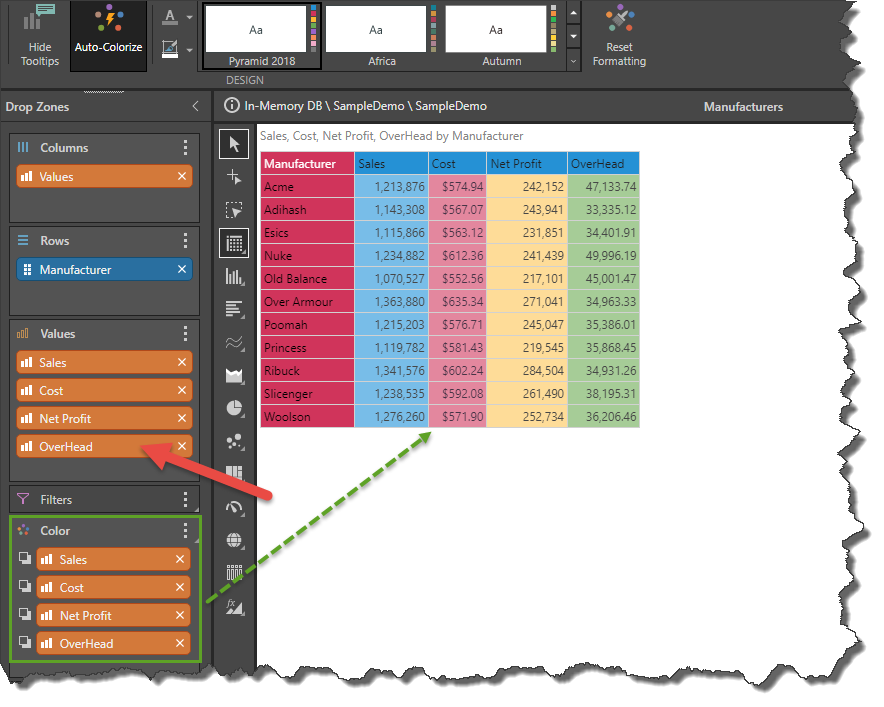
But now, after Overhead is added to the query (red arrow), each column is automatically colorized (green highlight):