When editing a series from a discrete legend, the first tab displays options for customizing series color.
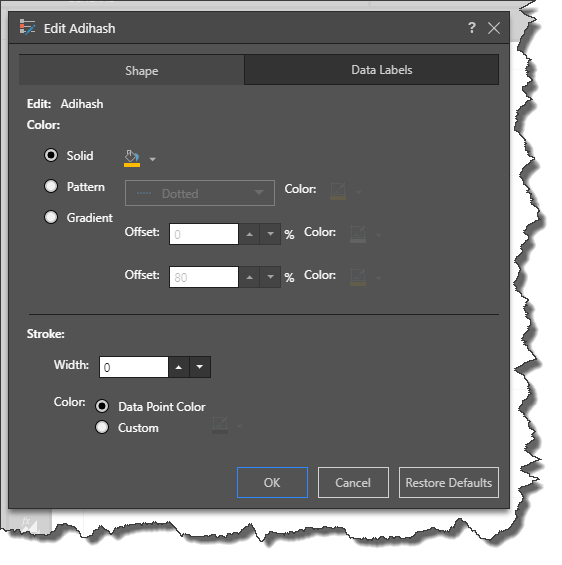
Edit: displays the currently selected element.
Color: edit the color of the current element. The available colors displayed are based on the currently selected theme.
Solid: choose a single solid color.
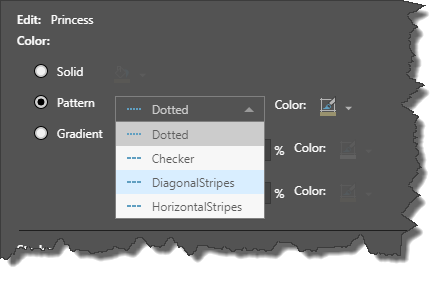
Pattern: select a pattern and color.
Gradient: select a gradient; you can choose both the base color, and the end color, to define. the range of the gradient
Stroke: add an outline to the element's chart segment by adding a width value and color. This can help to read the end of the segment when a gradient or pattern is selected.
Width: set to 0 by default; increase the width (in pixels) to display an outline.
Color: set the color of the outline:
Data Point Color: set the data point color as the stroke color.
Custom: choose a custom color.
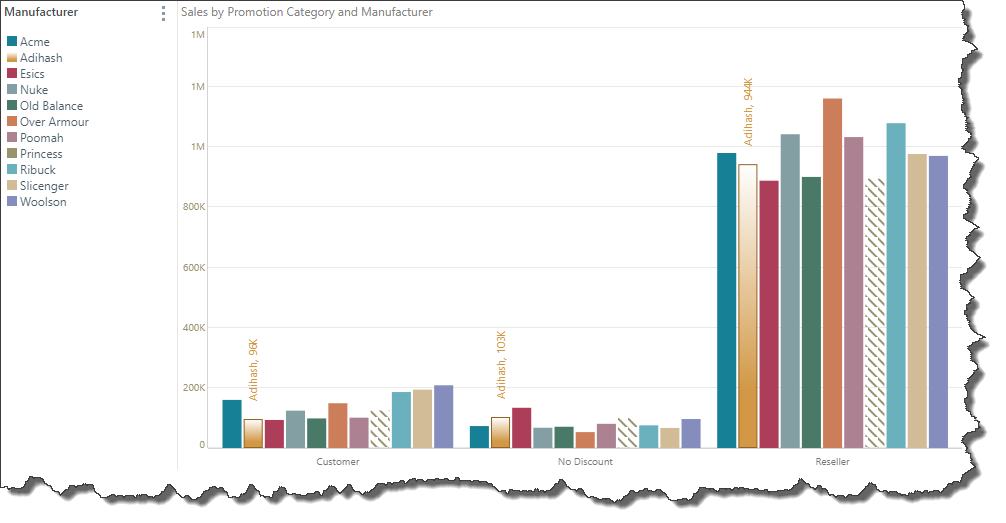
Example
In the example below, a gradient and stroke was added to the Adihash series, and a pattern was added to the Princess series: