Data Model Structures and Trees
Each tree can be traversed by the user, and items from within the trees are added to the drop zones in order to query the data model and build data visualizations.
This section of the help reviews the following trees and their function:
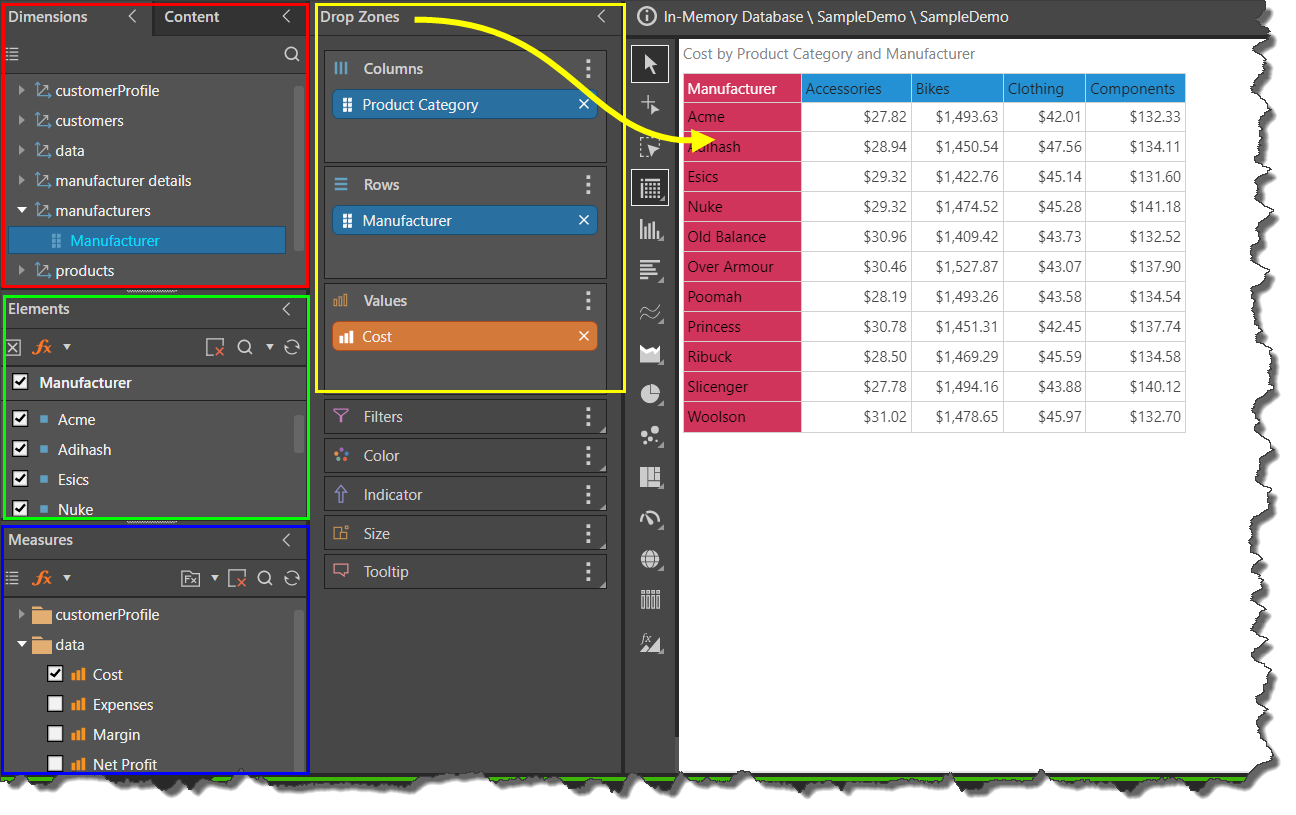
- Dimensions Tree: the Dimensions and Hierarchy Tree (red highlight below) contains the data model's dimensions, hierarchies and attributes, which correspond to tables and columns found in the datasource.
- Elements Tree: the Elements Tree (green highlight) exposes the individual member elements contained within hierarchies or attributes.
- Measures Tree: the Measure Tree (blue highlight) exposes the data model's values or measures, which are used to populate the visualization with quantitative data.
Refreshing Metadata and Localization
Data models are often changed and some come in multiple languages. The following topics cover how to refresh the meta structure elements of a data model inside a Discover session and how to change the language used to drive the different items as they appear in the tools.
- Metadata Refresh: used to refresh the data model's metadata (hierarchies, measures and elements).
- Languages: when working with MS OLAP, Tabular, SAP HANA, and SAP BW models, the language may be changed for the trees; trees that support given language will be translated.