Learn how to populate some slides in your presentation using natural language prompts typed or spoken into the Pyramid Chatbot. This example end-to-end process adds visuals, slicers, insights, and so on. It shows how you can explore your data using loose functional descriptions or ask precisely for the items that you want to include (for example, explicitly naming the visualization types you want to use or naming dimensions or measures).
The functionality is AI-driven, so the output you see may not exactly match the screen shots or description in here. You should be aware of this, and always be careful to check that you are happy with the output that you have generated.
Note: The process described in this guide is a "design time" activity that you can complete in either Present Pro or Present Lite. In addition to building your presentation at design time, you and your users can also use Chatbot to explore the visuals in your presentation at runtime. For more information, see Runtime Chatbot.
Before you begin
To be able to use the Chatbot:
- The administrator must have set up an LLM that enables the Chatbot for design time presentations in the Admin Console.
- You must have an Enterprise Edition license.
End-to-end process
Prior to getting started, launch Present and either open an existing presentation or create a new one. It doesn't matter whether the presentation includes any existing slides or content items, but we do recommend using empty slides for this walkthrough to ensure that you can fully understand the impact of the changes that you are making.
Step 1: Open Chatbot and select a model
- Click Chatbot (blue arrow below) at the bottom right of the page, alongside the app tabs.
- Select the model containing the data to include in the presentation from the options.
The Chatbot opens with the model selection panel visible.
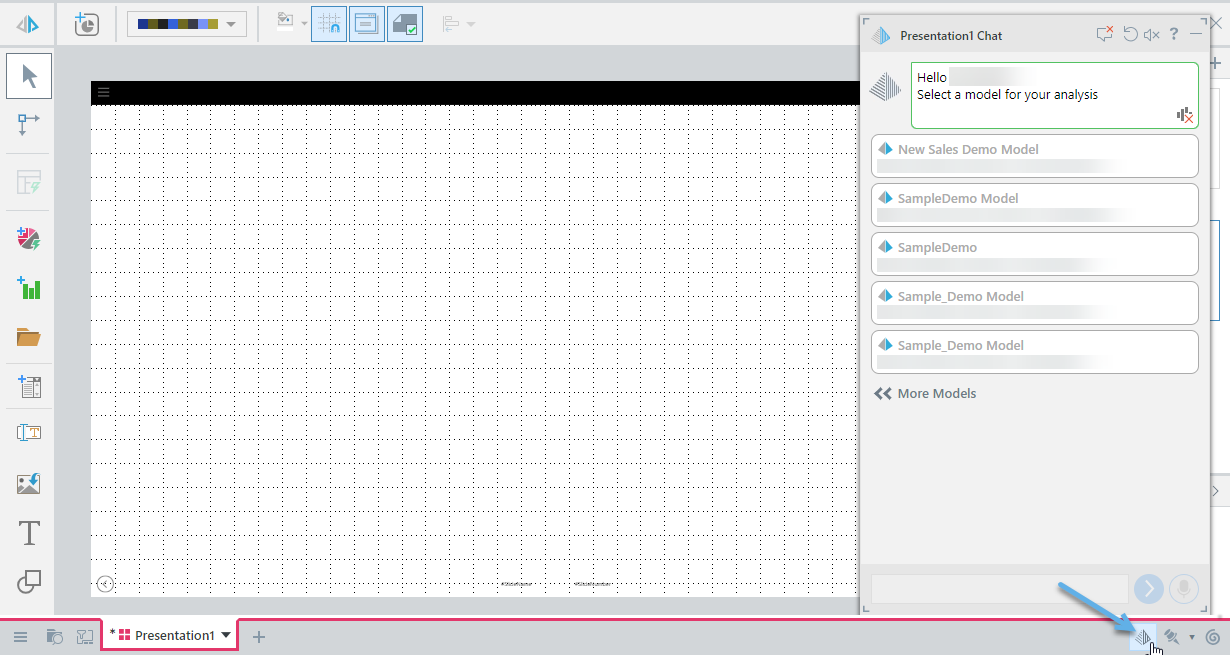
If needed, more models can be accessed by clicking on the << More Models option.
Step 2: Generate content from a simple prompt
With a slide open on the canvas:
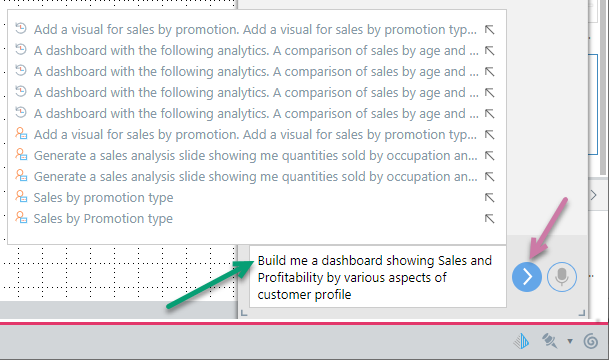
- Type a simple prompt, vaguely describing the type of business or analytic data, into the Chatbot using natural language.
- Click Run (purple arrow) to submit the prompt to the engine for generation.
Example: "Build me a dashboard showing Sales and Profitability by various aspects of customer profile" (green arrow):
After a short delay, Pyramid (i) generates the content for the slide and (ii) displays a confirmation message describing the new presentation in the chat (blue arrow below):
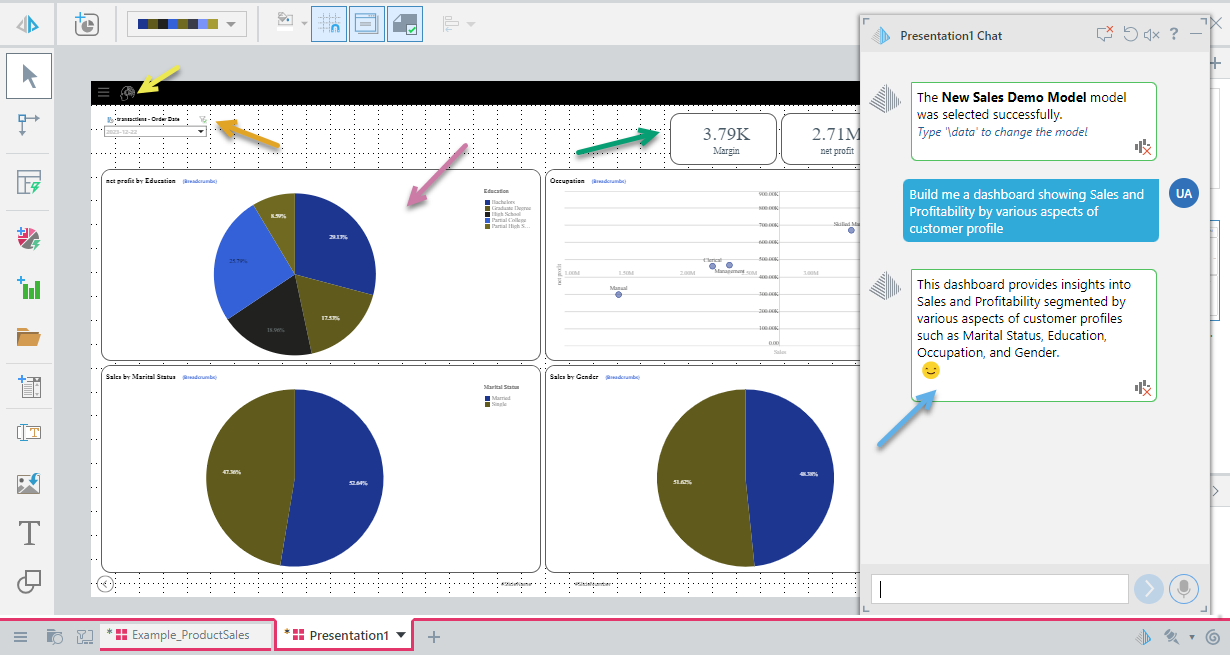
Your presentation may not look exactly like the preceding example, even with the same prompt, but it will include the following:
- A dynamic Slide Insights icon (top-left, yellow arrow). At runtime, you can hover over this icon to view AI-generated insight information about this slide in a pop-up. Note that this Slide Insights information will incorporate information relating to all of the visuals on the slide.
- One or more slicers (orange arrow). Slicers are enabled by default and may either be visible on the slide (as in this example) or accessible from the Present runtime menu at runtime.
- One or more visuals (purple arrow) satisfying the analytic question posed by your prompt. Because the prompt was vague, Pyramid uses AI to determine the required visualization types, measures, and dimensions to be included. Tip: You can edit each of the visuals by right-clicking on them and selecting Open in Discover where you can adjust or share them.
- A handful of headline metrics (green arrow).
Note: The AI engine determines the layout of the content items on the slide. You can rearrange the items by typing the Auto Layout option \layout into the Chatbot and selecting another option, or by manually adjusting the content on the canvas using drag and drop.
More information
- To learn more about using prompts, see Writing Natural Language Queries
Step 3: Generate content from an advanced prompt
- Add a new Slide by clicking the + (plus) icon at the top of the Slides panel (blue arrow).
- With the new slide selected, type a more detailed prompt, describing the type of data to include and the types of visuals or other details, into the Chatbot using natural language.
- Click Run.
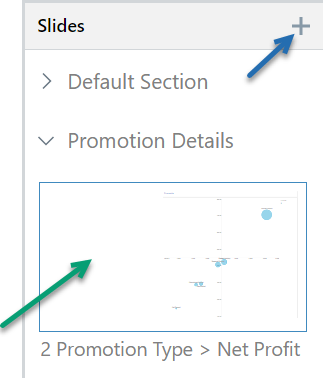
Tip: If you do not need a new slide, just select one of the existing slides in this panel (green arrow).
Example: "A dashboard with the following analytics. A comparison of sales by age and gender. A different report for a column chart of profitability by product subcategory. And a pie chart showing me manufacturer performance through returns, sales and expenses, and I want to slice it by years and show slide insights."
Note: Notice that the prompt is now much more specific. It names the visualization types (pie chart, column chart), indicates specific measures, dimensions, and slicers, and specifically asks to include slide insights.
Again, there is a short delay while Pyramid generates the slide content and response:
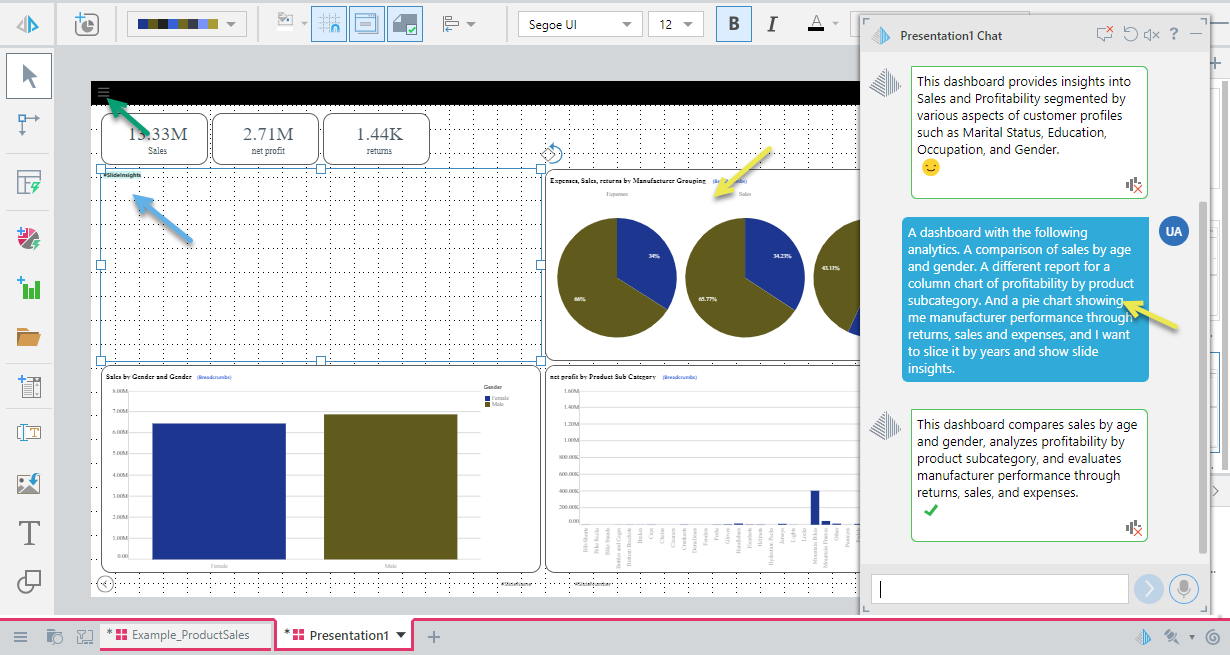
Again, your presentation may not look exactly as the preceding example even with the same prompt. Things to note about this slide:
- The slicer is included on the Present runtime menu, which will be accessed using the Hamburger menu at runtime (green arrow).
- Because Slide Insights are explicitly requested in the prompt, they are not added as a tooltip on an icon (as in the previous step) but as a Slide Insights text field added to the presentation (blue arrow). This will be replaced with the actual insight content when the slide is opened at runtime.
- Each of the visuals contains exactly the measures and dimensions described in the prompt, and also uses the visualization type described there. For example, the yellow arrows point to the prompt "a pie chart showing me manufacturer performance through returns, sales and expenses" and the visual created from this prompt (a trellised pie chart at the top-right).
Step 4: Review and modify the slides
Once created, you can modify the content of the slide or the presentation using the standard processes.
Adding, removing, or adjusting content items to suit your requirements:
Formatting and applying design features to your slides or overall presentation:
As you edit your presentation, you should regularly view your changes "at runtime." You can open the runtime view by clicking Run (top-left) or pressing F2 on your keyboard:
Step 5: Save the presentation
Save your presentation in My Content:

This saves your presentation locally.
More information
This step describes how to save your presentation locally. If you want other members of your team to be able to use or edit your presentation, and you have sufficient access rights to do so, you should save it to your workspace or public folders. For more information, see:
- To learn more about saving presentations, see Saving and sharing presentations
Alternative processes
To learn how to build a presentation without using AI: