Use the Item Picker tool to select multiple items on your visual. This tool is useful for selecting non-contiguous items; you click the data points or members one-by-one, rather than "lassoing" a collection of data points in a particular location.
Note: The Item picker has effectively the same behavior as the CTRL+Click keyboard shortcut. That is, each member or data point is selected as you click it, without the already selected items being de-selected. This tool is, therefore, useful for users without a keyboard. For more information, see Interactive Selections.
Using the Item Picker
You can use this tool to pick multiple members or data points on the canvas, and then use the right-click context menu to interact with all selected items as if they were one; for example, to Eliminate some cells or Focus on your selected members.
Tip: You can, alternatively, use the Lasso tools to make selections. The Select Lasso selects data points or members within a drawn shape on the canvas and, where it is available, the Zoom Lasso also zooms in on those selected items. Note that, in addition to selection, the lassos may also allow focus or "classify" actions on selected items, depending on your visualization type.
Enabling the Item Picker
From the Toolbox:
- Click Item Picker (green arrow below).
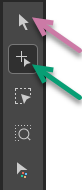
Selecting the Item Picker changes your cursor into a "multi-selection" tool, meaning that everything you click from now until you revert to the normal Selector tool (purple arrow above) will be added to your selection as if you were holding the Ctrl key.
Note: The preceding image shows the toolbox for a Layered Map. The Lasso options may differ for different visualization types.
Making your selections
Select the data points or members you want to select in your visual.
Important: When you select multiple items using the Item Picker (or CTRL+Click) you are selecting either a set of data points or a set of members. If you have selected more than one data point, say, and then you select a member, the data points will be de-selected.
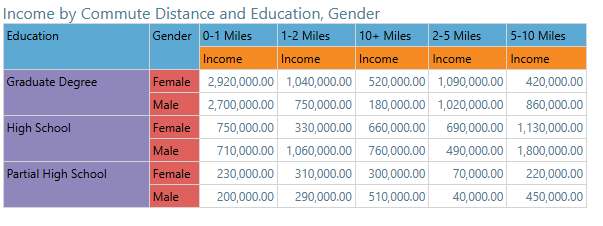
Grid
While you have the Item Picker tool enabled in the Toolbox, you can simply click each data point or member to select it in the grid. The selected items are highlighted as follows:
- Selected hierarchical items are shown with a blue halo.
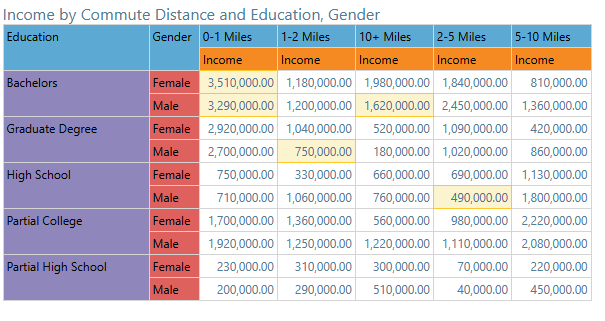
- Selected data points are shown with a yellow halo. Note: When you select members, the data points associated with the members are also highlighted, but when you select data points (as in the following example), the hierarchical items are not selected.
Once your items are selected, you can access actions applicable to your selections on the right-click context menu.
With the Item Picker selected from the Toolbox, click on the members you want to focus on.
In this example, the Graduate Degree, High School, and Partial High School members are chosen and the action selected from the context menu is performed on all of them (in this example, Focus). The items are highlighted when the members are selected:
- Selected hierarchical items are shown with a blue halo.
- Selected data points are shown with a yellow halo.
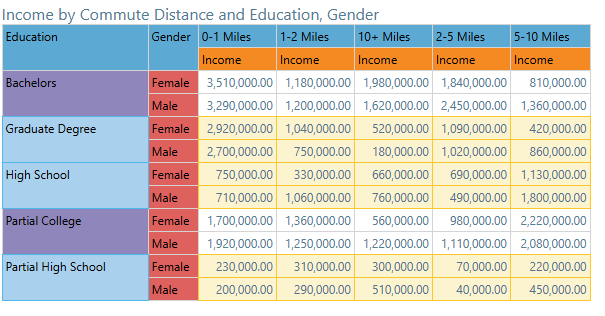
Once picked, you can right-click to open the context menu with options that can be used on all three items simultaneously:
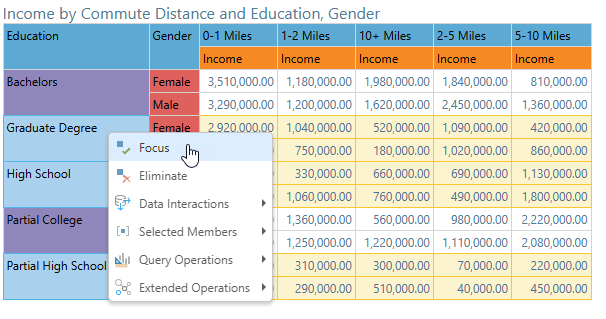
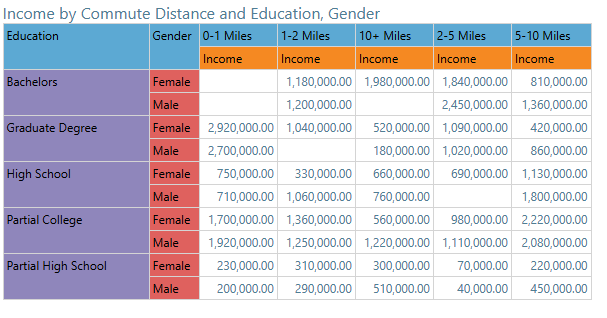
Clicking Focus from the right-click menu, focuses on the selected members:
Tip: Where items appear multiple times in the visual (like Female above), all instances will be selected when you click one of them.
With the Item Picker selected from the Toolbox, choose multiple data points.
Right-click one of the selected cells and click Eliminate on the context menu. All the selected data points are removed from the query:
Tip: You can revert your elimination, adding the eliminated values back in to the discovery, by (1) clicking Undo (if you are in the same session), (2) opening the Elimination wizard and removing the elimination from the Elimination Settings, or (3) selecting Eliminations > Remove Eliminations from the Query Ribbon.
Other visualization types (non-Grid)
While you have the Item Picker tool enabled in the Toolbox, you can simply click each data point or member to select it in the chart. The selected items are highlighted as follows:
- Selected items in a non-grid visual are highlighted in full color.
- Non-selected items are "washed out." That is, they appear paler.
Once your items are selected, you can make use of functions on the right-click.
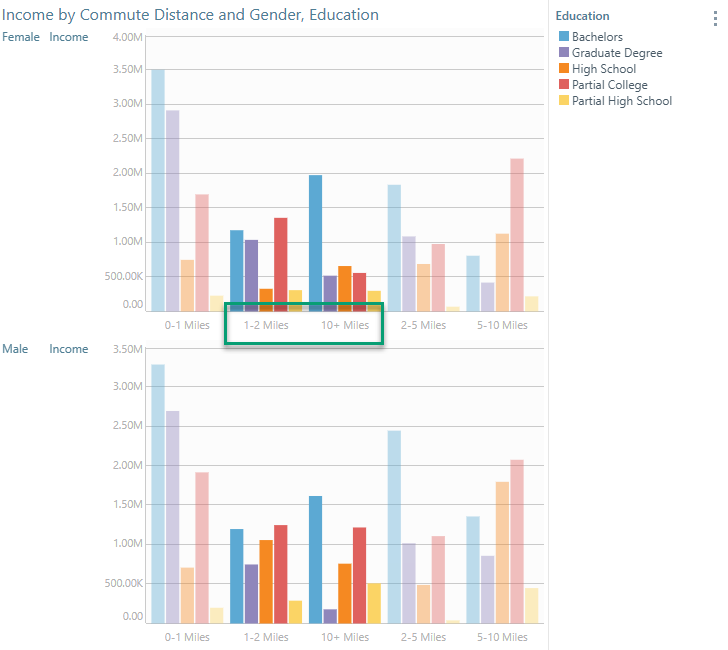
With the Item Picker selected from the Toolbox, click on the members you want to focus on. In this example, we want to focus on all members apart from Graduate Degree, so we select these non-contiguous items in the Legend with the item picker on:
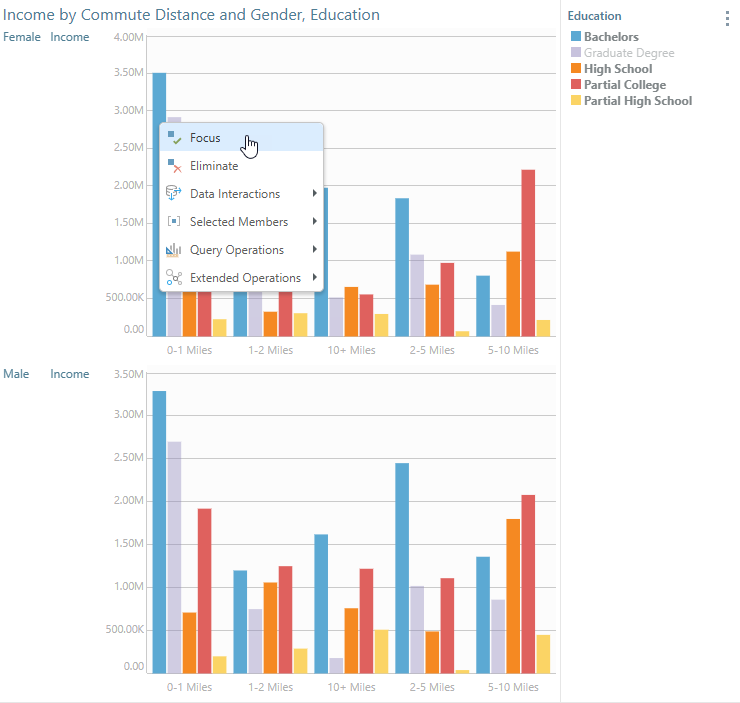
Once picked, you can right-click any selected item and click Focus in the context menu. The effect is as follows:
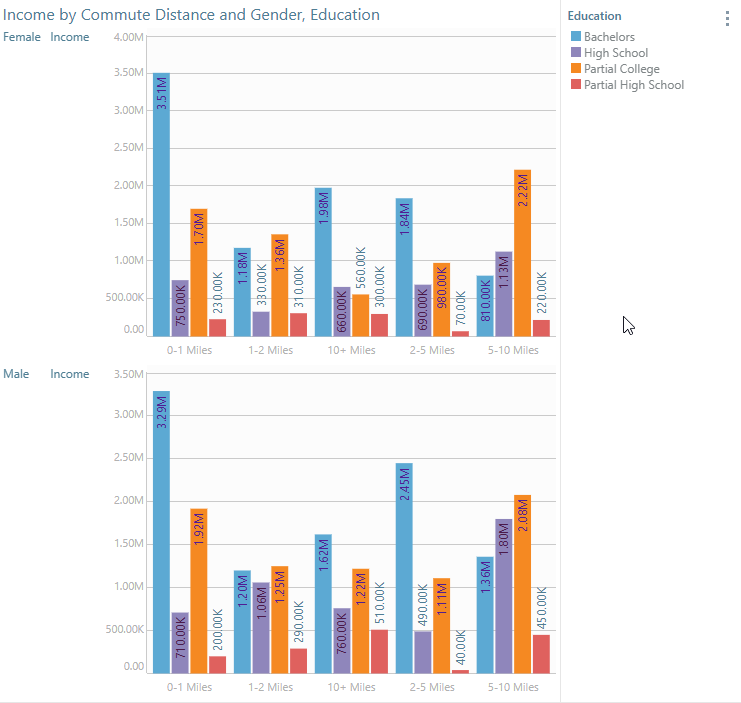
- Graduate Degree is no longer shown anywhere in the chart; there are no Graduate Degree columns and no associated Legend item.
- The meaning of the column colors is changed. Purple columns previously represented income for those with Graduate Degrees, but now represent income for those with High School diplomas. If you want to "fix" the colors to particular member types, see Member Color Lock.
Tip: When you have the Item Picker selected and are multi-selecting items in a Map, you can still use your cursor to drag the Map around. This allows you to move to and select different parts of the visual.
Related information
Which items are present on the right-click menus when you have multiple members or data points selected depends on your selections and your discovery's visualization type. For more information, see: