The Forecasting wizard can be used to project future values in a time series, such as corporate sales over the next four quarters. The wizard relates to row data as a time line, and builds additional rows for forecasting purposes. The wizard provides six built-in forecasting models and also allows you to design your own custom forecasting models. At any point in time, there can be one (and only one) forecasting model attached to the query.
Adding Forecasts
To access the forecasting commands, click Forecasting icon in Query ribbon.
- Basic Forecasting: attaches one of the eight built-in forecasting models to your query - or uses 'best fit' to find the best solution across all eight algorithms.
- Advanced Forecasting: opens a dialog to select and customize a forecasting model or provide a custom Python or R forecast script.
- Remove Forecasting: detaches the forecasting model from your query AND reruns the query without forecasting.
Forecasting Chips
Adding basic forecasting transforms all measure chips in the query into orange forecasting chips, which are automatically added to the Values drop zone. This allows you to easily compare forecasting for different measures.
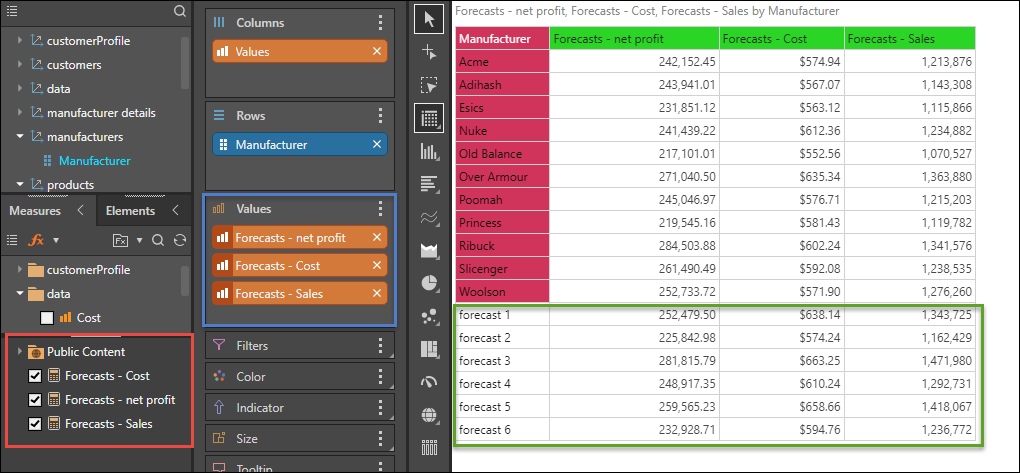
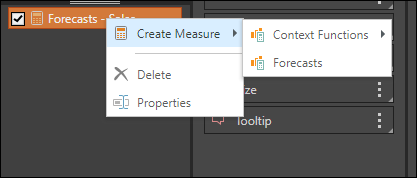
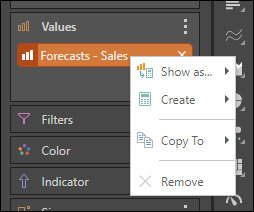
The forecast calculations will appear under the Measures panel; from here you can add or remove the chip. Right-click on the calculation to use it to create another measure, or delete it, or update its properties.
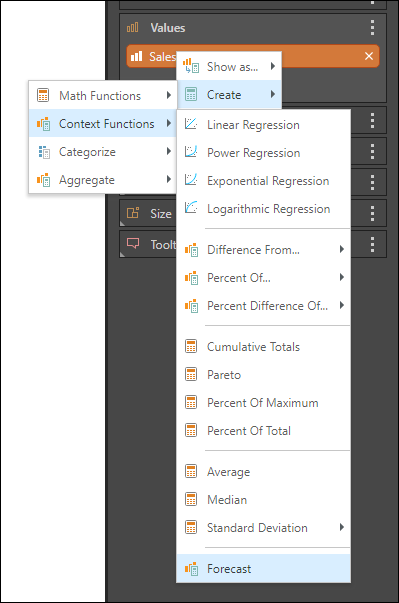
Right-click on the chip in the drop zone to use it to build context calculations, copy the chip to another drop zone, or remove the chip.
If you add more measures to the query, and add basic forecasting again, the new chips will not be affected. Instead, you'll need to right-click on the chip and add forecasting from the context menu.
Forecast Prediction Intervals
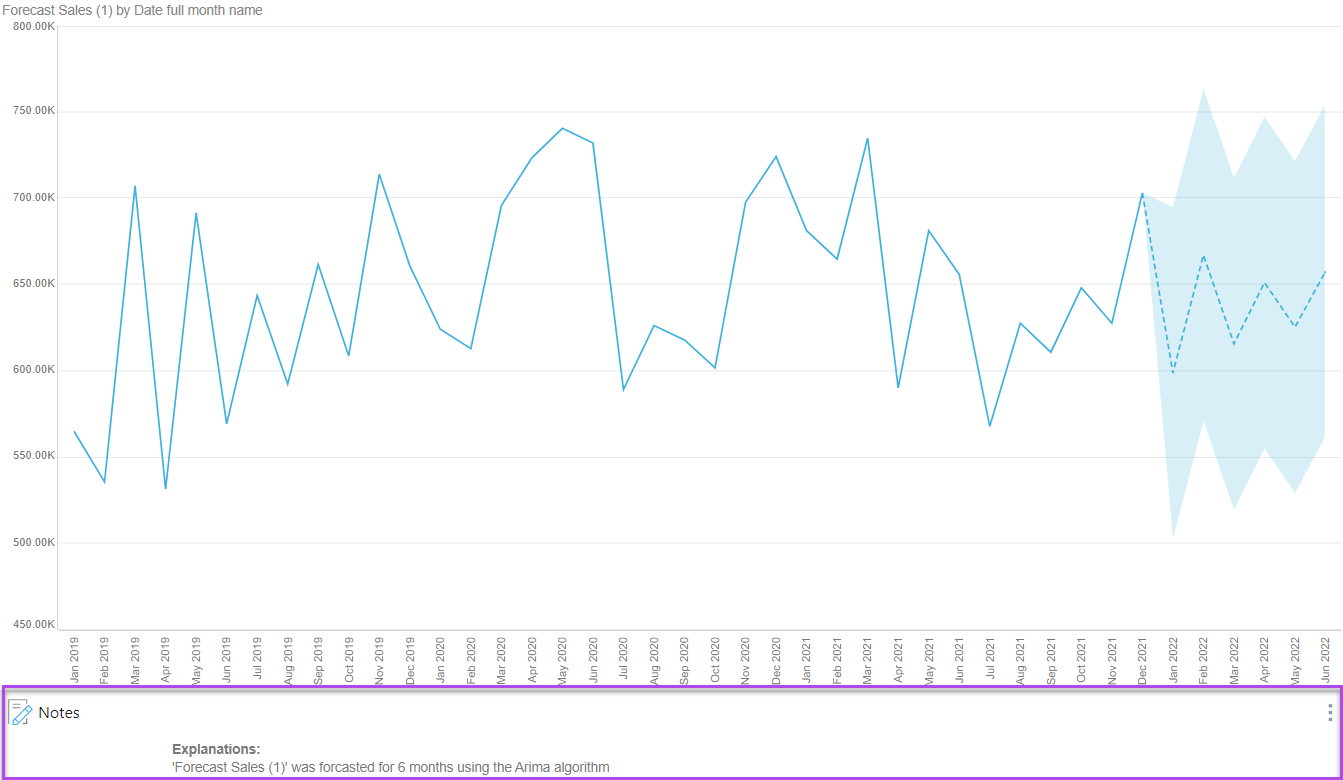
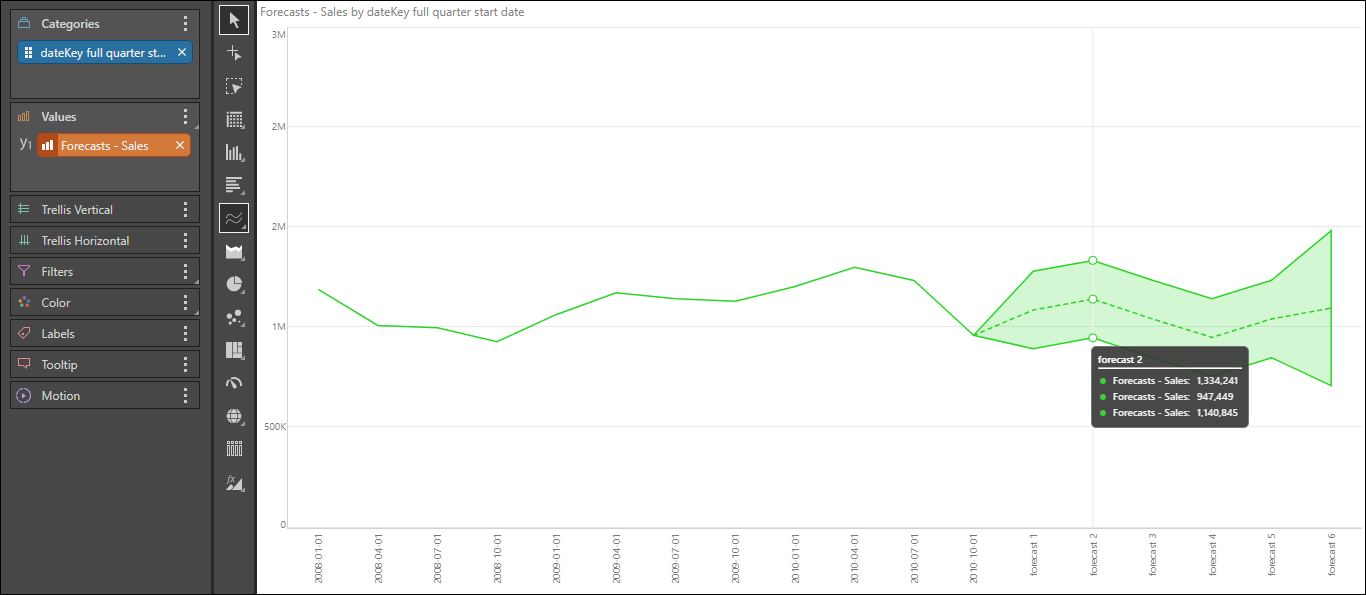
When forecasting is added to a line or area chart, the future forecasted values will appear with shading. This is the "prediction interval," which represents the spread of possible values. When hovering over the confidence interval, the tooltip will display the highest value (top 90% confidence level), the lowest value (bottom 90% confidence level), and the median value (represented by the dotted line).
The confidence interval should resemble a cone in shape; this is because the earliest predictions should be more accurate than the later predictions.
Tips for Working with Forecasting
Here are some quick tips for working with forecasting:
- Forecasting will not run if there are empty cells in the grid
- Forecasted cells appear within report grids and charts but cannot be managed from the hierarchies or elements panels
- If your input grid values change, the query must be rerun to update the content of forecasted cells
- Forecasted cells are labeled or highlighted within the visualization
- Once attached to a query, a forecasting model remains part of the query unless removed by the user
Explanations
Applying a forecasting calculation to the query auto-generates an explanation that you can show in your visual using the Notes tool. This explanation describes how the forecasting was calculated; it contains the calculation name, the forecast length, and the forecasting algorithm used.
To view the auto-generated explanation, click Show Notes from the Design ribbon. The explanations can also be viewed downstream in presentations.
In the example below, the explanation describes how the forecasting calculation was evaluated for the query: