Date-Time calculations are used to add date-time groupings to the visual if the data model being queried does not already contain the needed groupings. In this case, the user can open the submenu of the dateKey hierarchy (or a number of other date-time hierarchies), where they can select the required calculation.
Some date-time calculations add the relevant dates or periods to the visual, while others produce a slicer that is automatically added to the canvas. In the latter scenario, the user then makes the required date selection from the slicer, and visual will be filtered to show all the dates or periods according to the selected date-time calculation.
This functionality provides a way for users to add complex date-time calculations with just a few mouse-clicks, giving the flexibility to display a range of date-time groupings in the visual, without any need to construct complex formulations.
Selecting a Date-Time Calculation
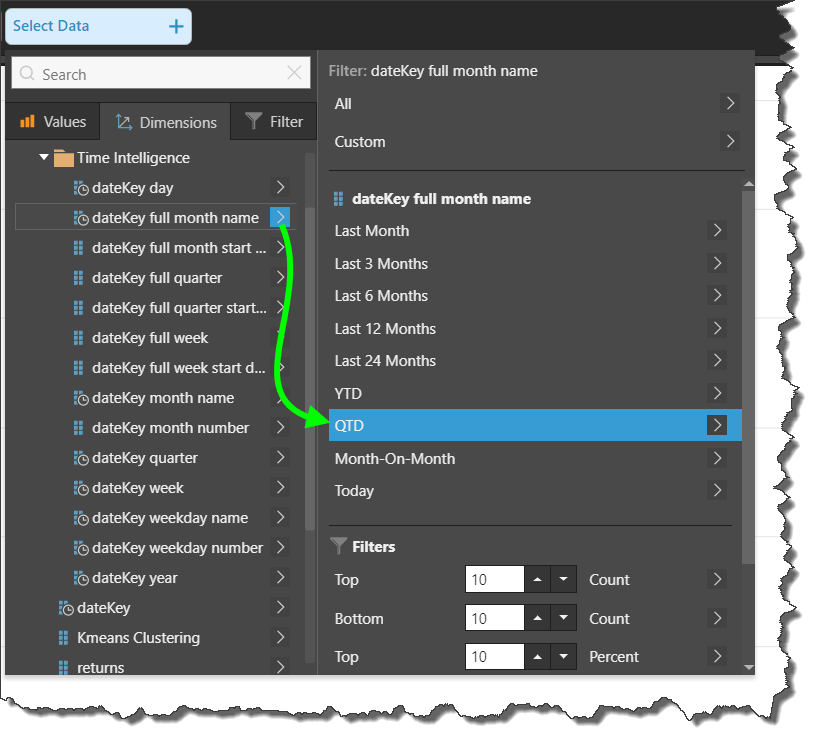
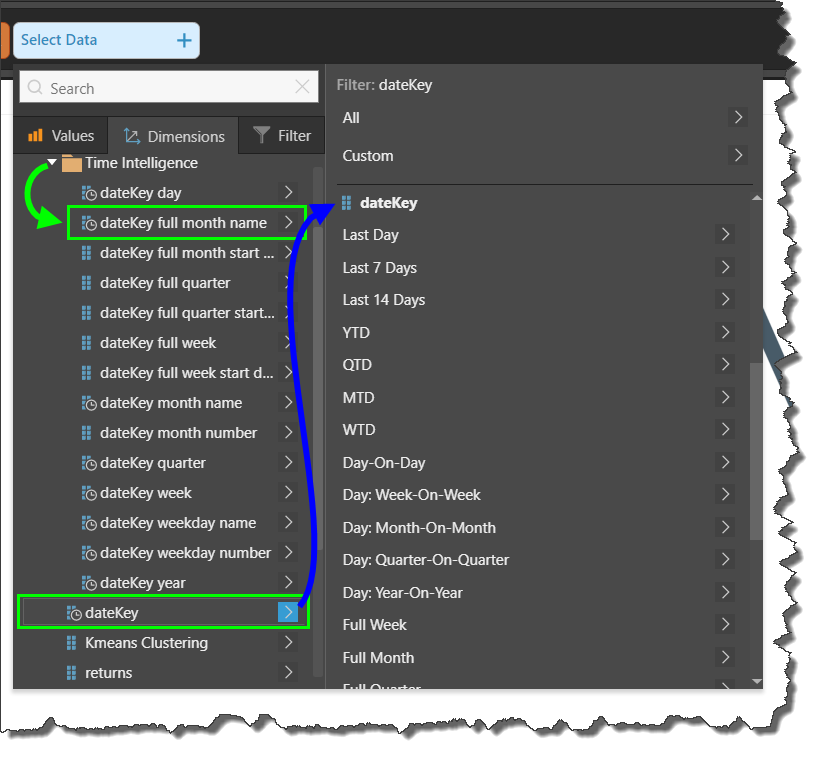
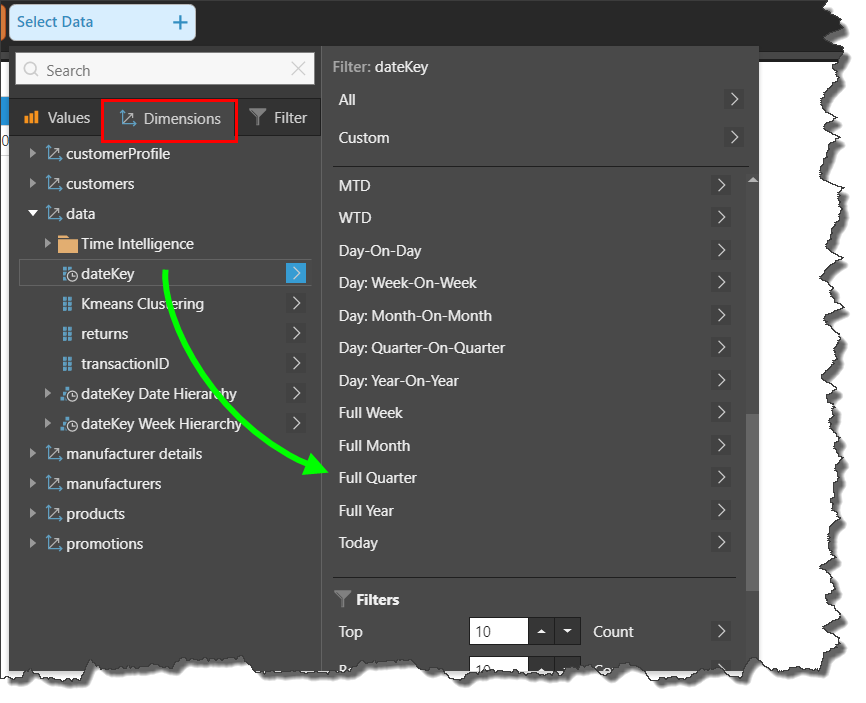
To access the Date-Time calculations, open the submenu for the dateKey hierarchy, or other date-time hierarchy; the date-time calculations supported by the given hierarchy will be listed. Simply select the required calculation.
Date-Time Hierarchy vs Filter
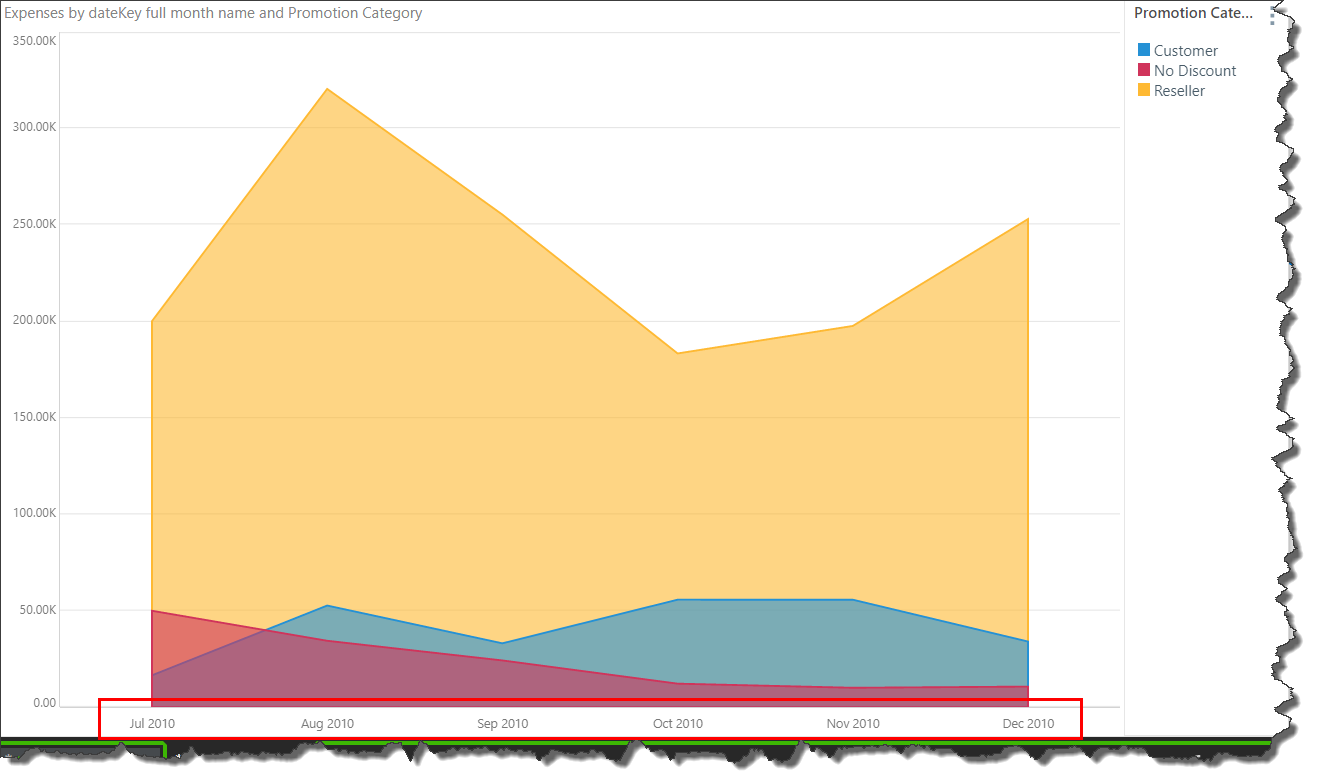
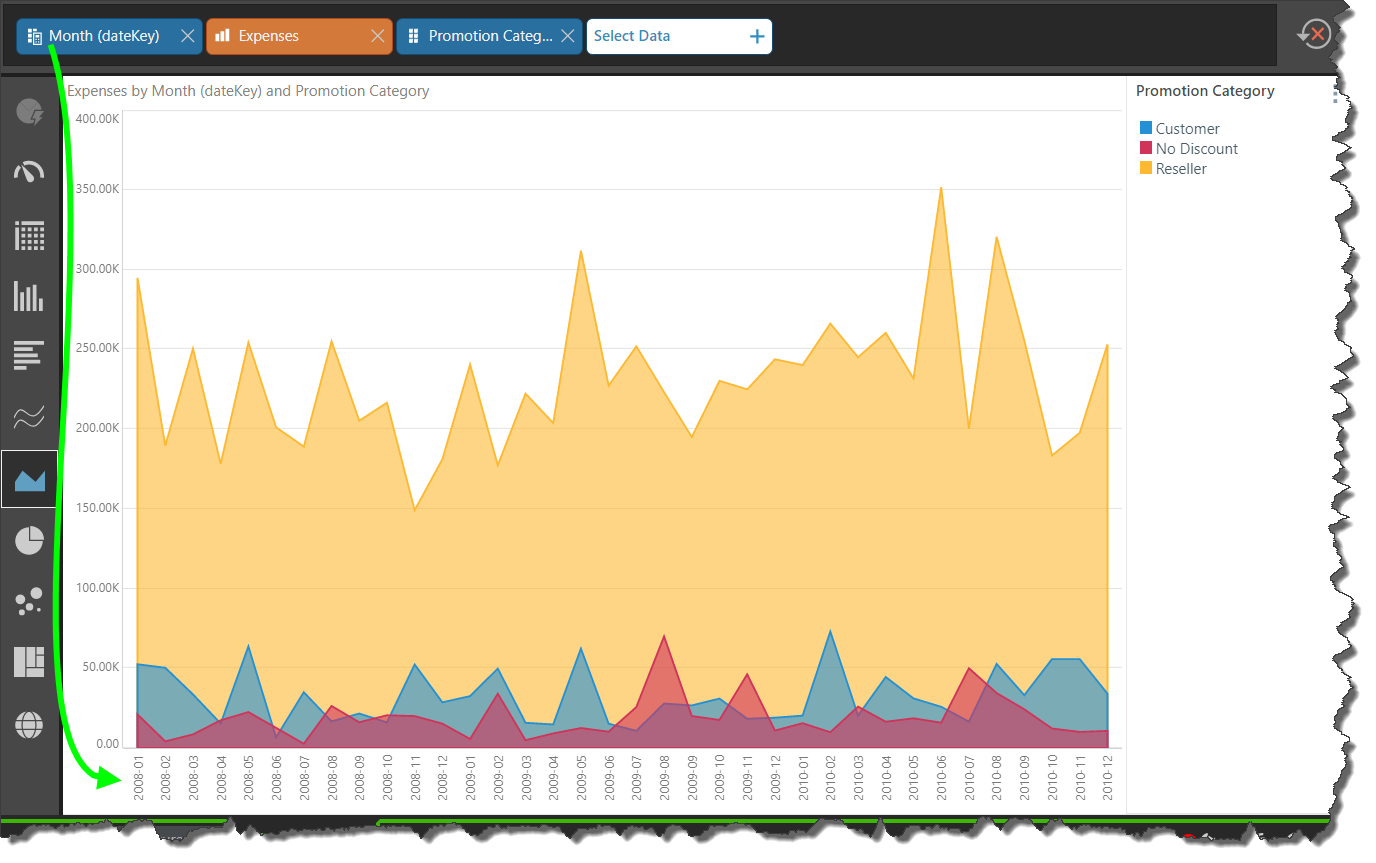
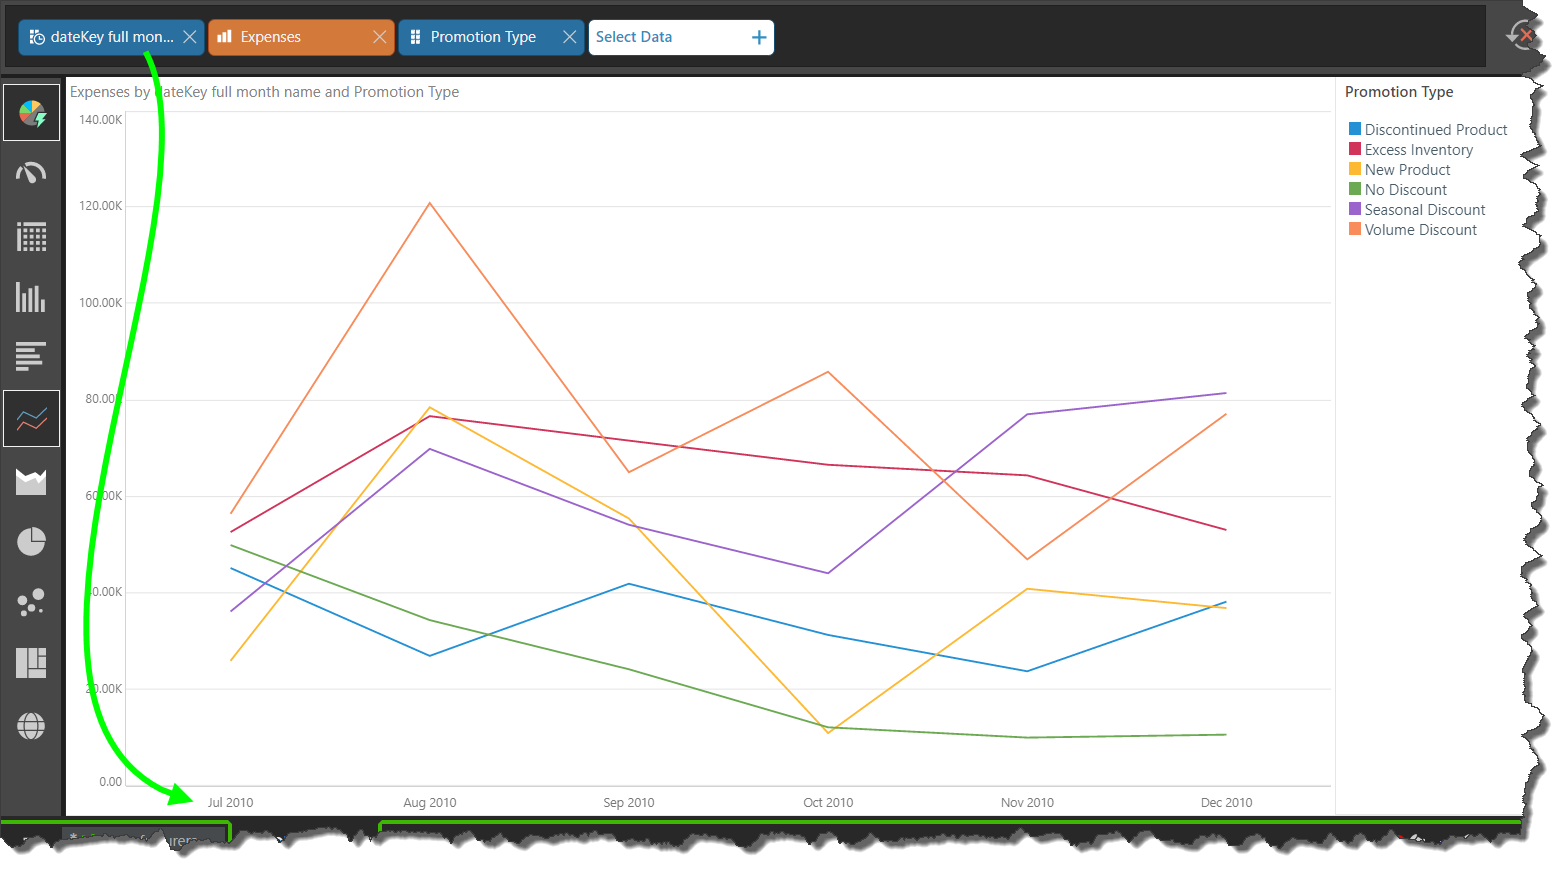
You can add a date-time calculation as a hierarchy selection or as a filter selection. The former option allows you to add the date-time calculation to the visualization as any other hierarchy. This is useful if, for instance, you want your visual to display a trend over time. For example, the visual below displays expenses for promotions; adding the full month calculation as a hierarchy added the months to the y-axis, so the visual displays a monthly trend:
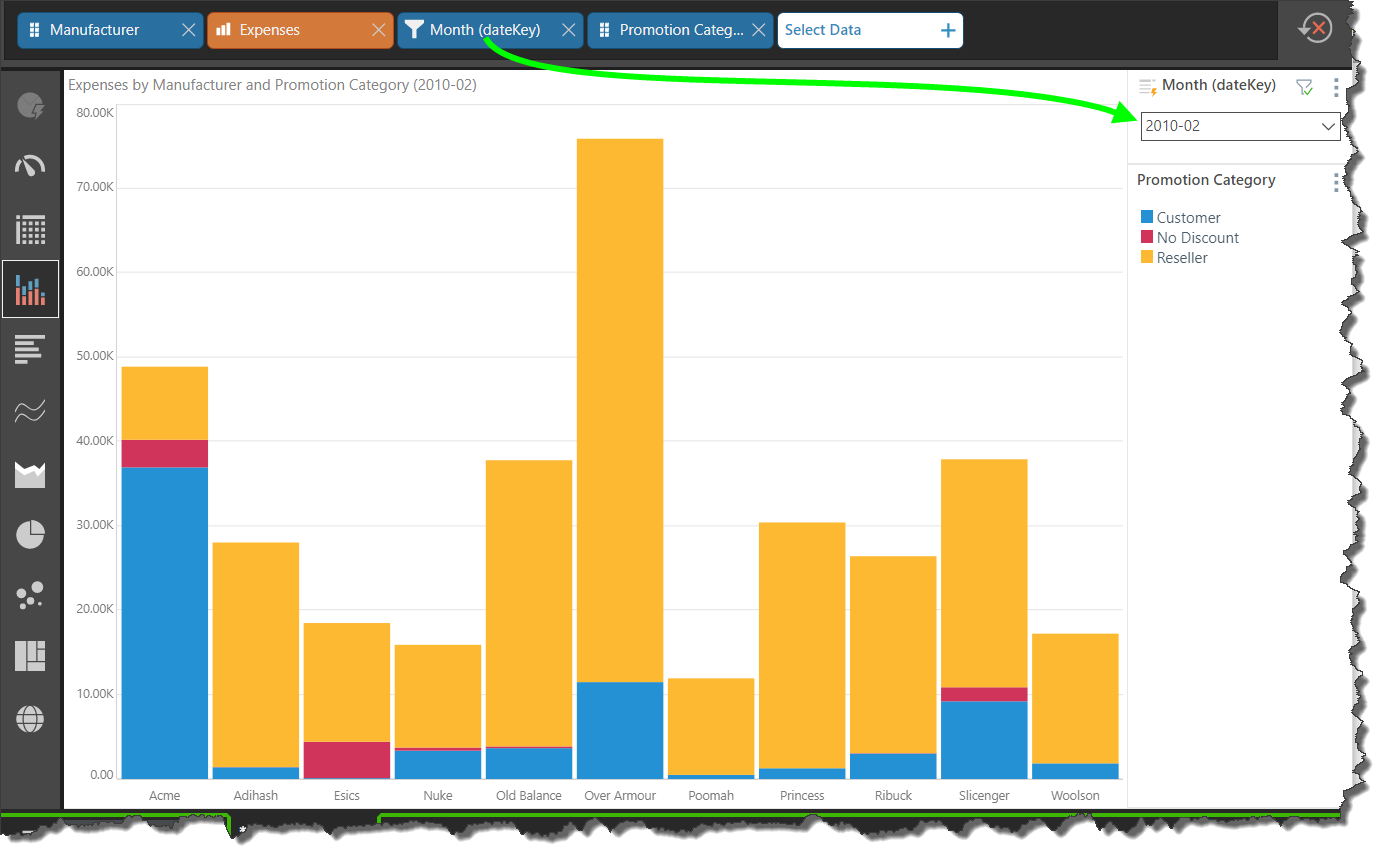
The latter option allows you to filter your visualization by the selected date-time calculation. This is useful if you want your visual to display precise information within a given time-frame. For example, the visual below displays expenses for promotions by manufacturers; adding the full month calculation as a filter enables filtering by specific month, so the user can filter out data from other months:
Review of Date-Time Calculations
The calculations that are exposed depend on the type of date/ time hierarchy that you select. If you select a dateKey hierarchy, the calculations will be based on days. However, a number of Time Intelligence columns support calculations for other date/ time groupings. If you select the 'full month name' time intelligence hierarchy, the calculations will based on months. Alternatively, select the 'week' hierarchy to choose week-based calculations, the 'quarter' hierarchy to choose quarter-based calculations, or the 'year' hierarchy to choose year-based calculations.
Continue reading for details about each of the date-time calculations.
Last Period
Use these options to display the last x time periods prior to the current period. Selecting a Last Period calculation adds the corresponding date/ time elements to the visualization.
- Last Day: display the last day prior to the current day.
- Last 7 Days: display the last 7 days.
- Last 14 Days: display the last 14 days.
- Last Week: display the last week prior to the current week.
- Last 4 Weeks: display the last 4 weeks.
- Last Month: display the last month prior to the current month.
- Last 3 Months: display the last 3 months.
- Last 6 Months: display the last 6 months.
- Last 12 Months: display the last 12 months.
- Last 24 months: display the last 24 months.
- Last Quarter: display the last quarter prior to the current quarter.
- Last 2 Quarters: display the last 2 quarters.
- Last 4 Quarters: display the last 4 quarters.
- Last Year: display the last year prior to the current year.
- Last 3 Years: display the last 3 years.
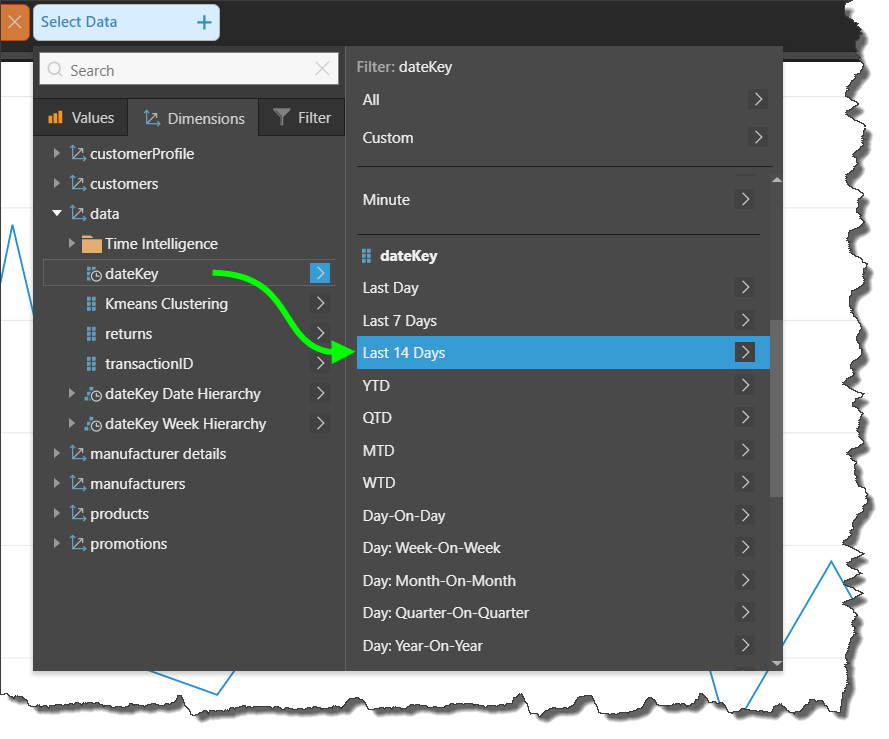
Last 14 Days
Here, the Last 14 Days calculation was selected from the dateKey hierarchy's submenu.
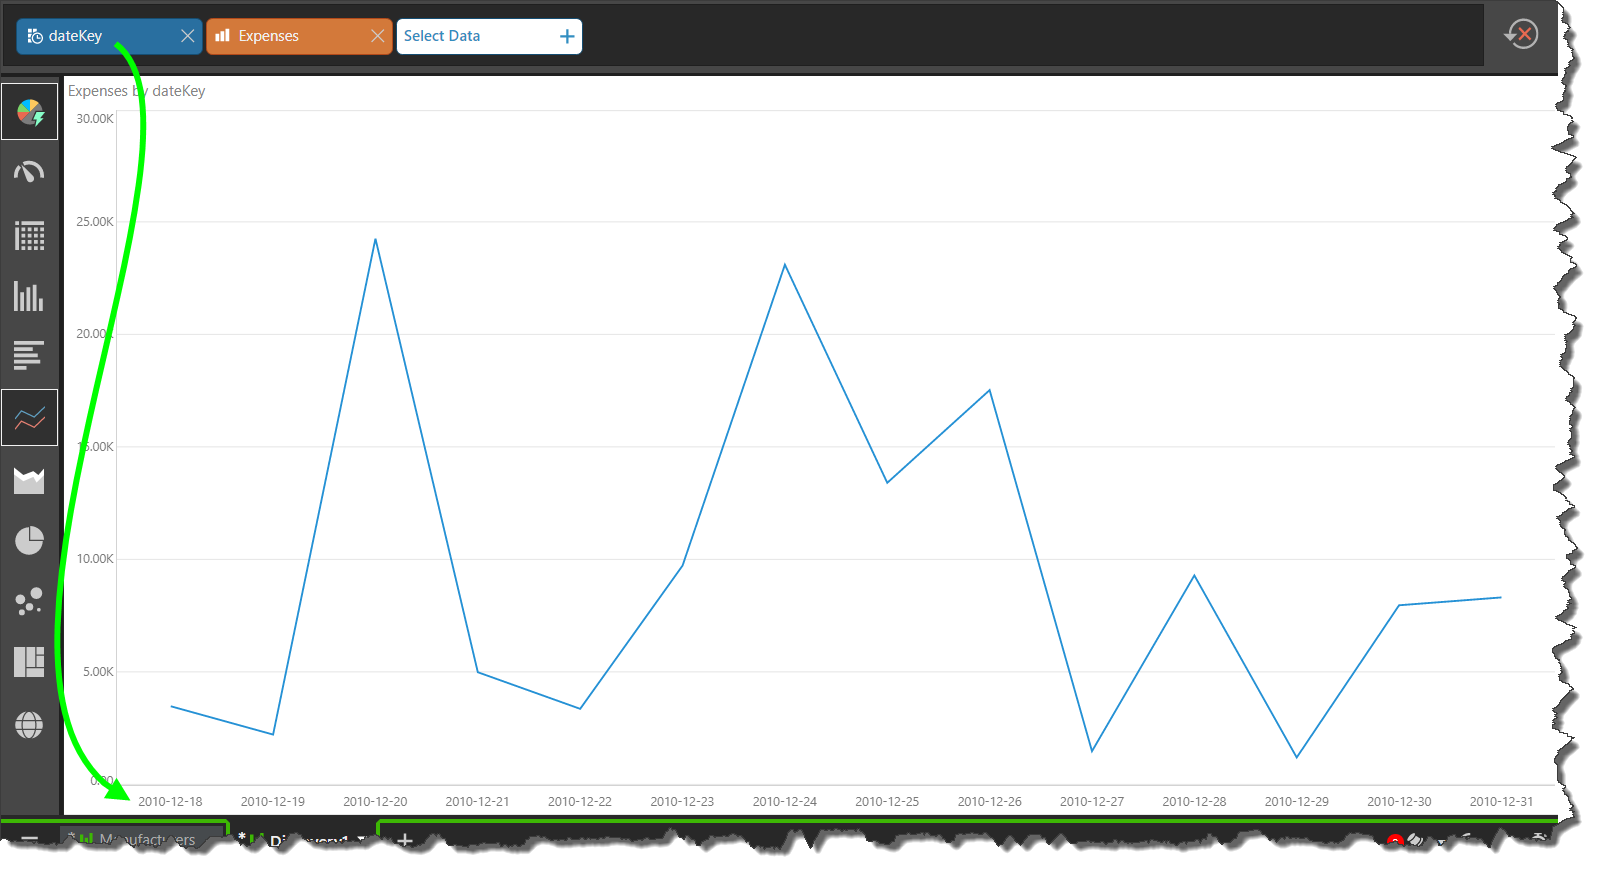
The last 14 days is then automatically added to visual. In this example, it is plotted along the y-axis of the line chart, to display a trend over time.
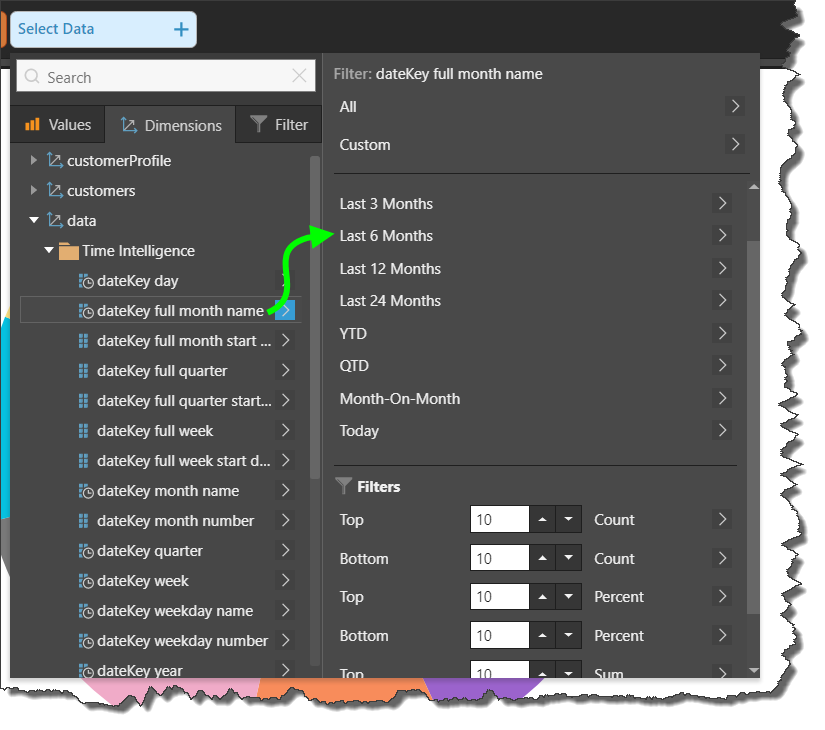
Last 6 Months
Now the Last 6 Months calculation was selected from the 'full month name' hierarchy from the Time Intelligence folder:
The last 6 months are added to the visual:
Period To Date
Selecting a Period to Date calculation adds a parameter slicer to the canvas. From the slicer, select the required date or time period to display data for the given period to date.
- YTD: 'year to date' will display a list of time periods from the beginning of the given year, up to and including the selected period. For instance, if the dateKey hierarchy is selected and the given date is May 21, 2019, a list of all dates from January - May 21 will be returned. However, if the 'full month name' time intelligence hierarchy is selected, and May 2010 is selected from the slicer, the visual will display all months in 2010 up to and including May.
- QTD: 'quarter to date' will show a list of dates from the beginning of the given quarter, up to and including the selected date. For instance, all dates from April 1 - May 21, 2019. Alternatively, is the 'full month name' time intelligence hierarchy is selected, the QTD calculation will display the months in the quarter which contains the chosen month, up to and including the selected month. For example, if May 2010 is selected from the slicer, the visual will display April and May.
- MTD: 'month to date' will display a list of dates from the beginning of the given month, up to and including the selected date. For instance, all dates from May 1 - May 21, 2019.
- WTD: 'week to date' will display a list of dates from the beginning of the given week, up to and including the selected date. For instance, all dates from May 19 - May 21, 2019.
The YTD calculation is available for dateKey and full month name hierarchies.
The YTD calculation is available for dateKey and full month name hierarchies.
The MTD calculation is available for the dateKey hierarchy only.
The WTD calculation is available for the dateKey hierarchy only.
The following examples will compare the difference between the QTD calculation added from the dateKey hierarchy, versus from the full month name hierarchy.
Quarter to Date from dateKey
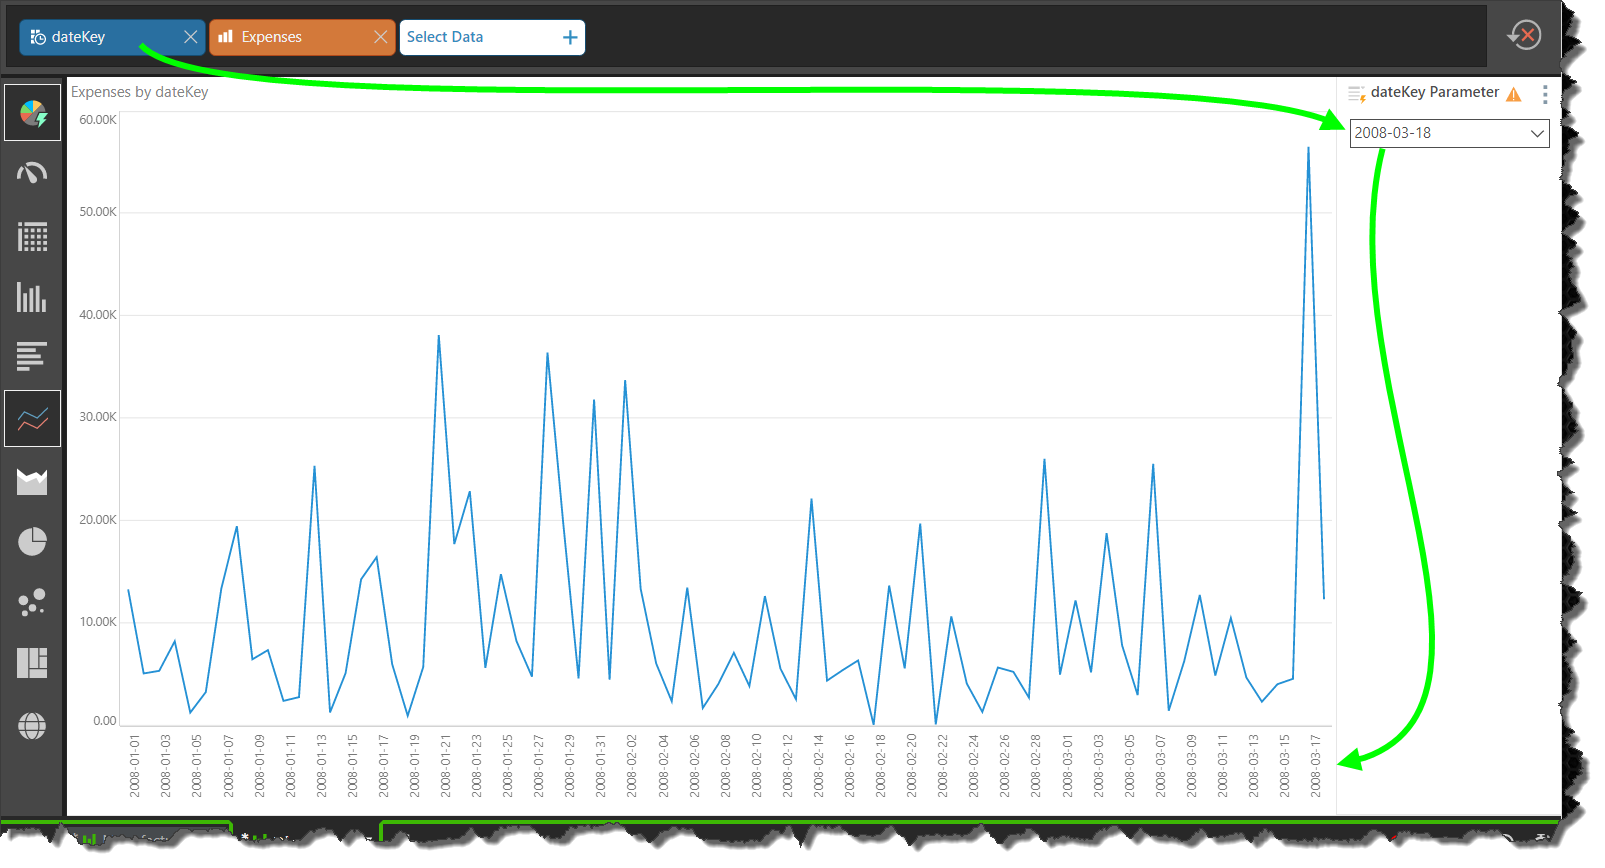
When added from the dateKey hierarchy, a parameter slicer is automatically added to the canvas. The slicer contains a list of all dates in the dateKey hierarchy.
When a date is chosen from the slicer, a list of all dates in the quarter to which the chosen date belongs is added to the visual. In this example, the dates in Q1 2008, up to and including 18 March, were plotted along the y-axis.
Quarter to Date from Full Month Name
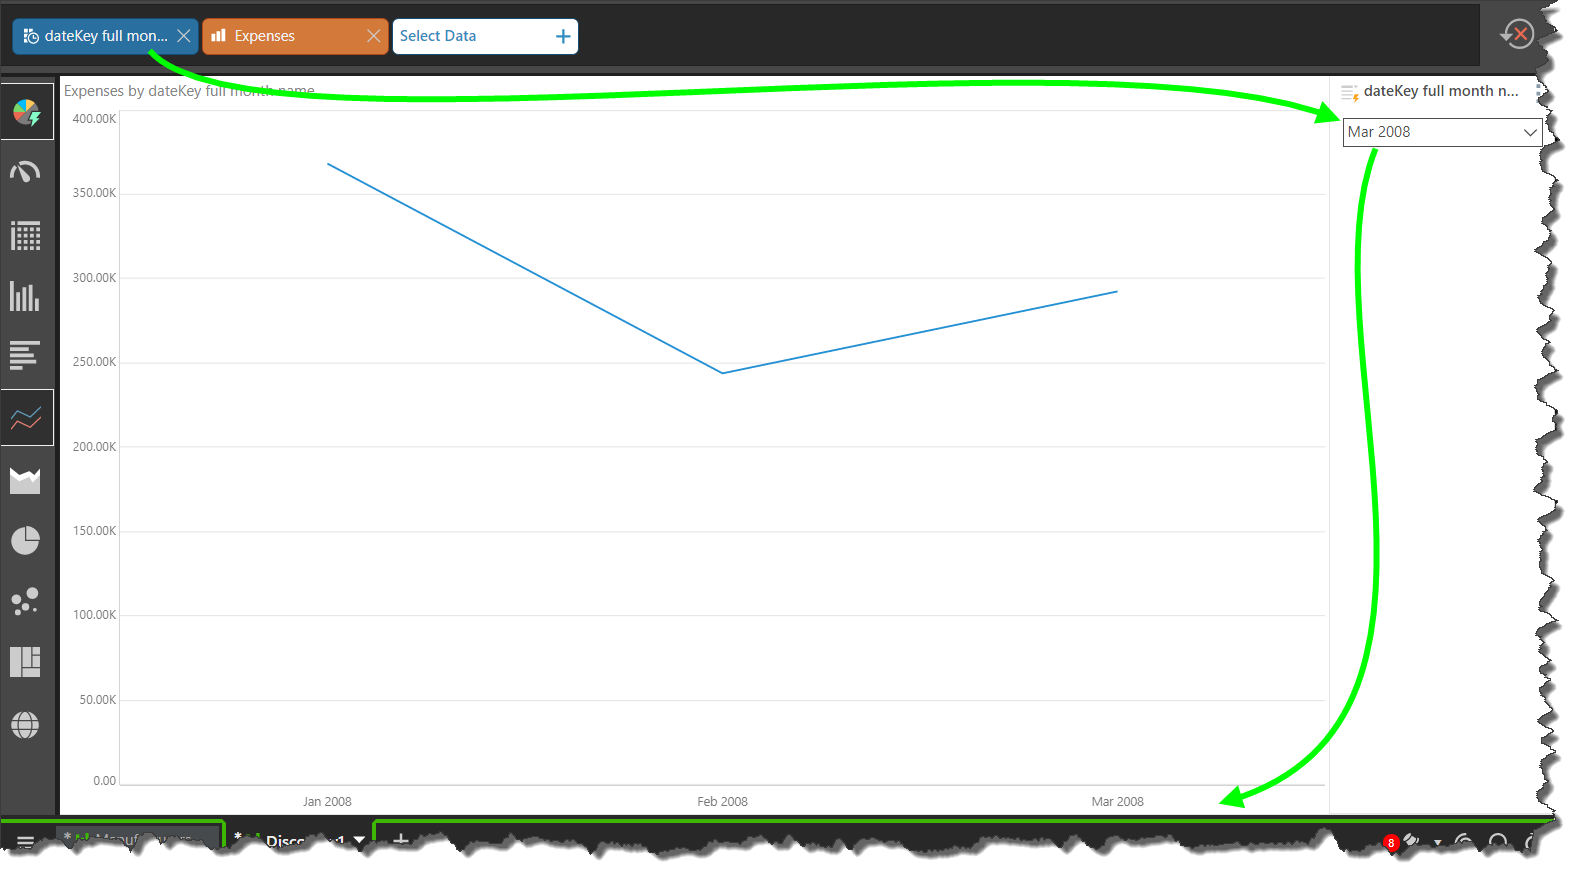
When the QTD calculation is selected from the full month name hierarchy, the parameter slicer that is produced contains a list of all months in the full month name hierarchy.
When a month is chosen from the slicer, a list of all months in the quarter to which the chosen month belongs is added to the visual. In this example, March 2008 was selected from the slicer; so each month in Q1 2008, up to and including March, was added to the visual:
Period on Period
Use the period on period functions to see the given member element and the element that is one position before it, in the same grouping level. For instance, if a Quarter on Quarter calculation is selected, and date selected from the slicer is Q2 2010, then both Q2 2010 and Q2 2009 are shown in the visual.
- Day-on-Day: display the selected day and the previous day. Available from the dateKey hierarchy.
- Week-on-Week: display the selected week and the previous week. Available from the 'week' time intelligence hierarchy.
- Month-on-Month: display the selected month and the previous month. Available from the 'full month name' time intelligence hierarchy.
- Quarter-on-Quarter: display the selected quarter and the previous quarter. Available from the 'quarter' time intelligence hierarchy.
- Year-on-Year: display the selected year and the previous year. Available from the 'year' time intelligence hierarchy.
- Day Calculations: from the dateKey hierarchy, each of the above calculations is exposed from the date level. When a calculation is selected, a date slicer is produced; the visual will display the selected date and the date in the previous period. For example, if Day: Year on Year is chosen, and 2 April 2010 selected from the slicer, the visual will display 2 April 2010 and 2 April 2009.
These examples compare the Day: Week-on-Week calculation with the Week-on-Week calculation.
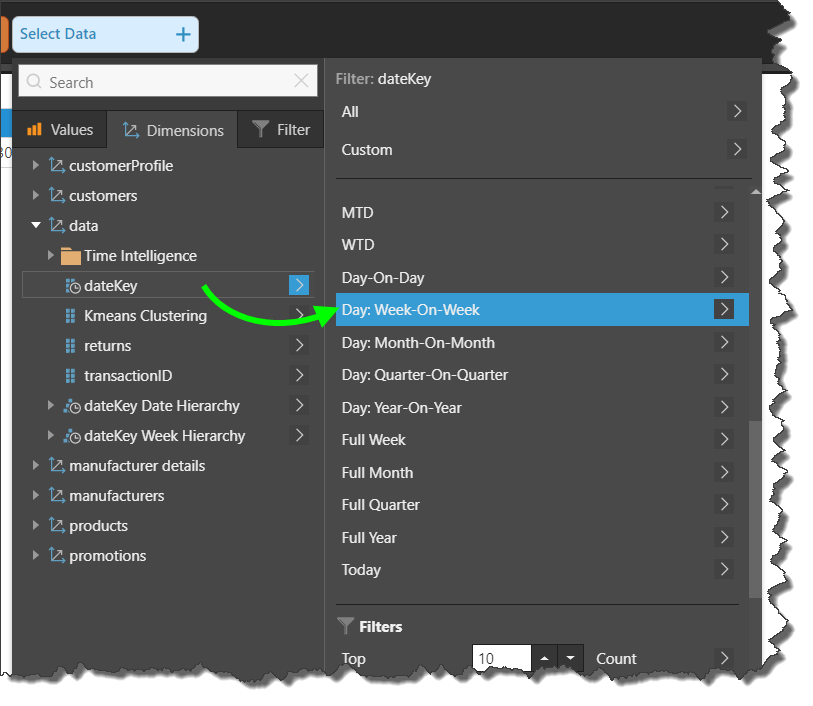
Day: Week on Week
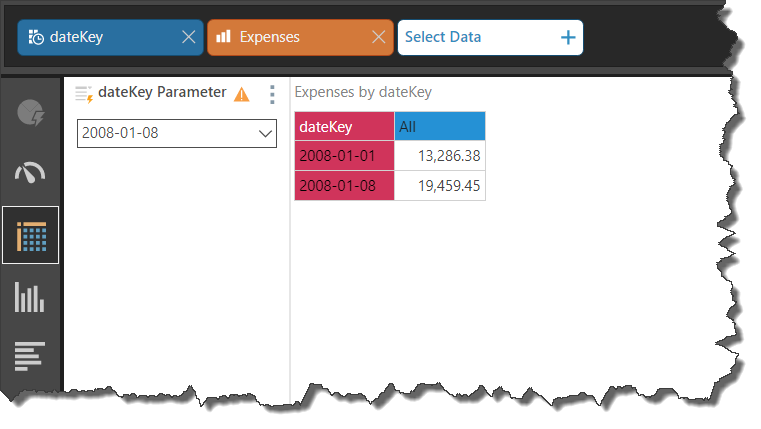
The Day: Week-on-Week calculation is exposed from the submenu of the date-Key hierarchy:
When selected, a parameter slicer is added to the canvas; this slicer lists all the dates in the dateKey hierarchy. When a date is selected from the slicer, the chosen date and the date 1 week prior to it are added to the visual. Here, the date selected was 8 Jan, 2008; the dates added to the visual were 8 Jan and 1 Jan 2008:
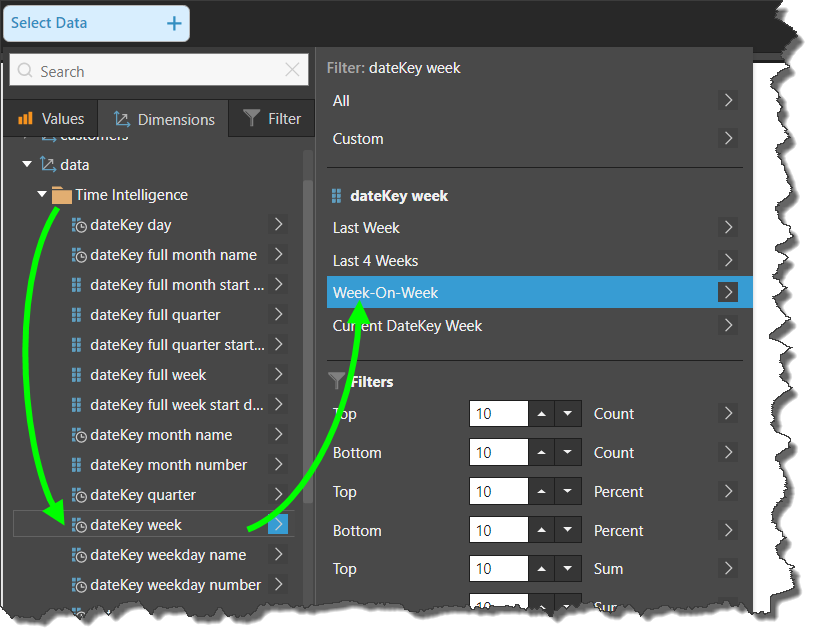
Week on Week
Here, the Week-on-Week calculation was selected from the submenu of the 'week' hierarchy, which is located in the Time Intelligence folder.
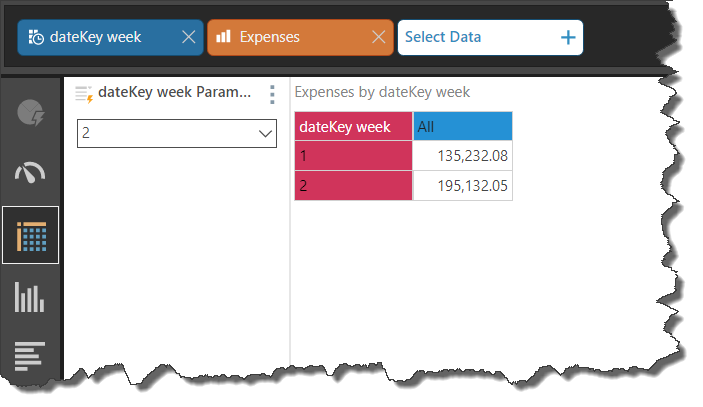
After selecting the calculation, a parameter slicer was automatically added to the canvas; this slicer lists all the week numbers contained in the 'week' hierarchy. When week 2 is selected from the slicer, both week 2 and week 1 are displayed in the visual.
However, the 'week' hierarchy contains week numbers only; it does not differentiate between weeks of different years. This means the visual is displaying data for weeks 1 and 2 of all the years for which the dateKey hierarchy contains data.
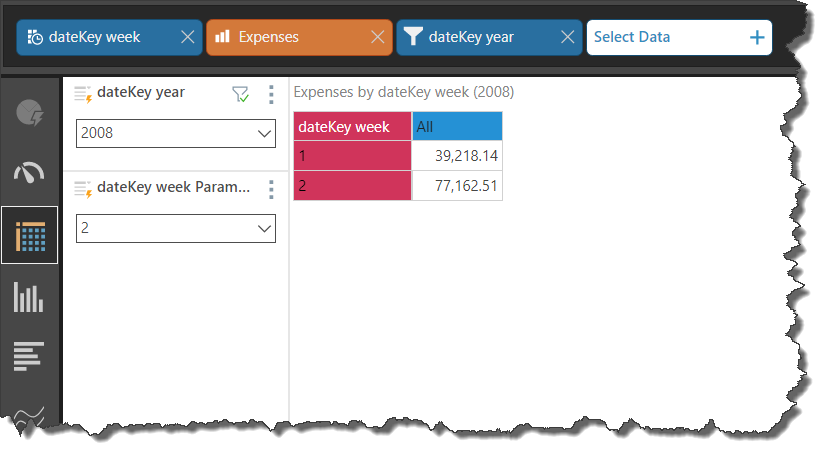
In order to specify the relevant year in the visual, the 'year' hierarchy was added as a filter. Here, the year 2008 is selected from the Year filter, so the visual displays weeks 1 and 2 of 2008:
Full Period
Use the full period functions to see all dates within the chosen time period. For example, if you choose Full Month, and then select August 3, 2010 from the slicer, the visual will display all dates from the month of August, 2010.
These calculations are available from the dateKey hierarchy only. When a Full Period calculation is chosen, a dateKey slicer is added to the canvas; select the required date from the slicer to display all dates.
- Full Week: select a date to display all dates in the week of the selection.
- Full Month: display all dates in the month of the selected date.
- Full Quarter: display all dates in the quarter of the selected date.
- Full Year: display all dates in the year of the selected date.
These examples compare the difference between added the Full Quarter calculation as a hierarchy selection, versus as a filter selection.
Full Quarter Hierarchy
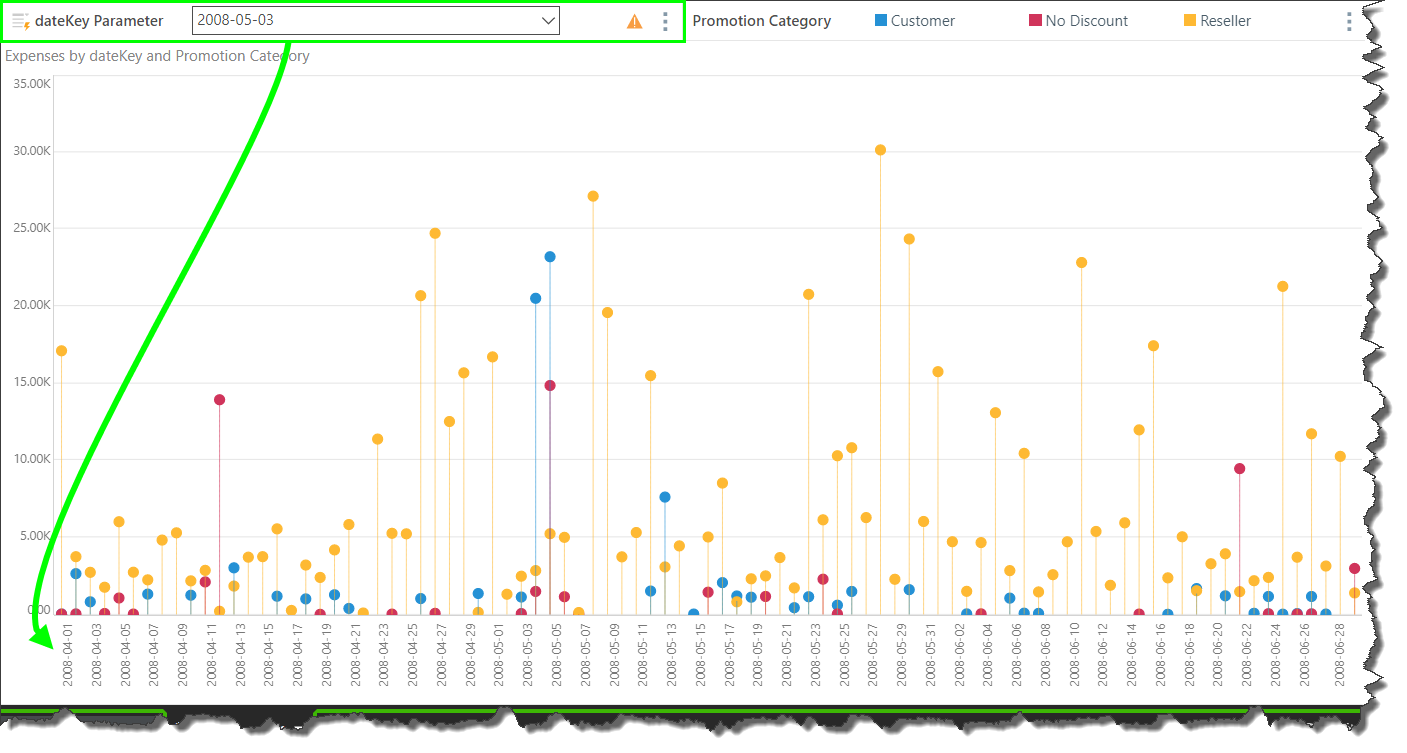
Here, the Full Quarter calculation was added as a hierarchy selection:
Selecting the calculation added a parameter slicer to the canvas; the slicer lists all dates in the dateKey hierarchy. When a date is selected, all dates in the quarter to which the chosen date belongs are added to the visual.
In this example, the selected date was 3 May, 2008; all dates within Q2, 2008 were added to the visual:
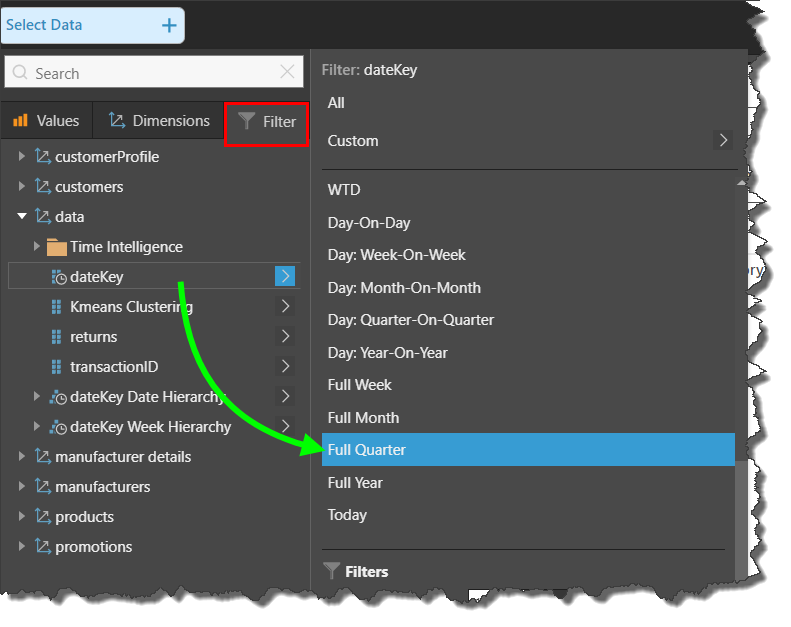
Full Quarter Filter
In this example, the Full Quarter calculation was added as a filter selection:
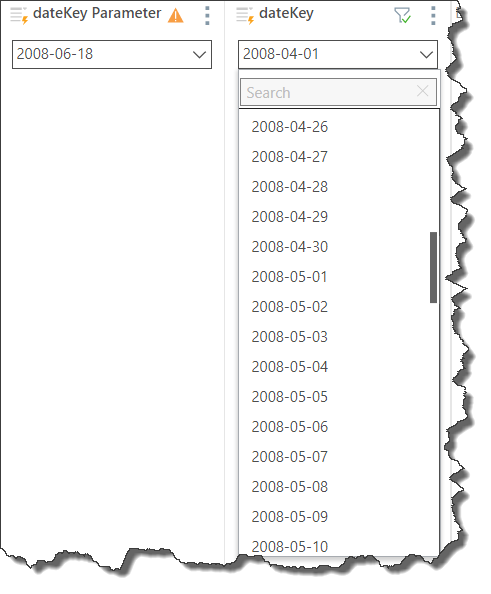
When the calculation is selected, 2 dynamic slicers are automatically added to the canvas. The first is a parameter slicer that lists all the dates in the dateKey hierarchy. The second slicer is fed by the first slicer; when a selection is made from the parameter slicer, that selection cascades to the second slicer, populating it with all dates in the quarter to which the selected date belongs.
Here, the date selected from the parameter slicer was 18 June, 2008:
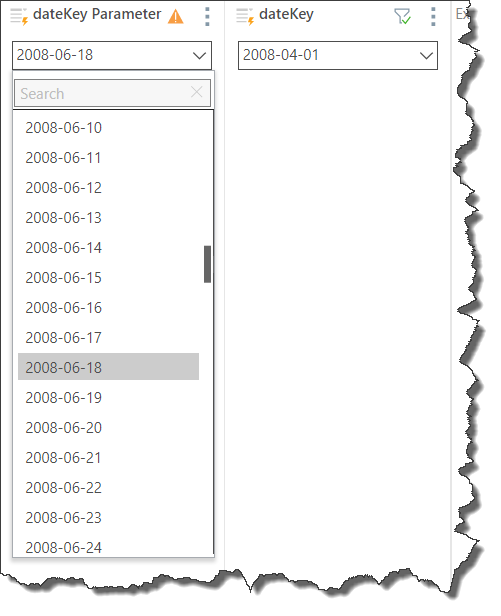
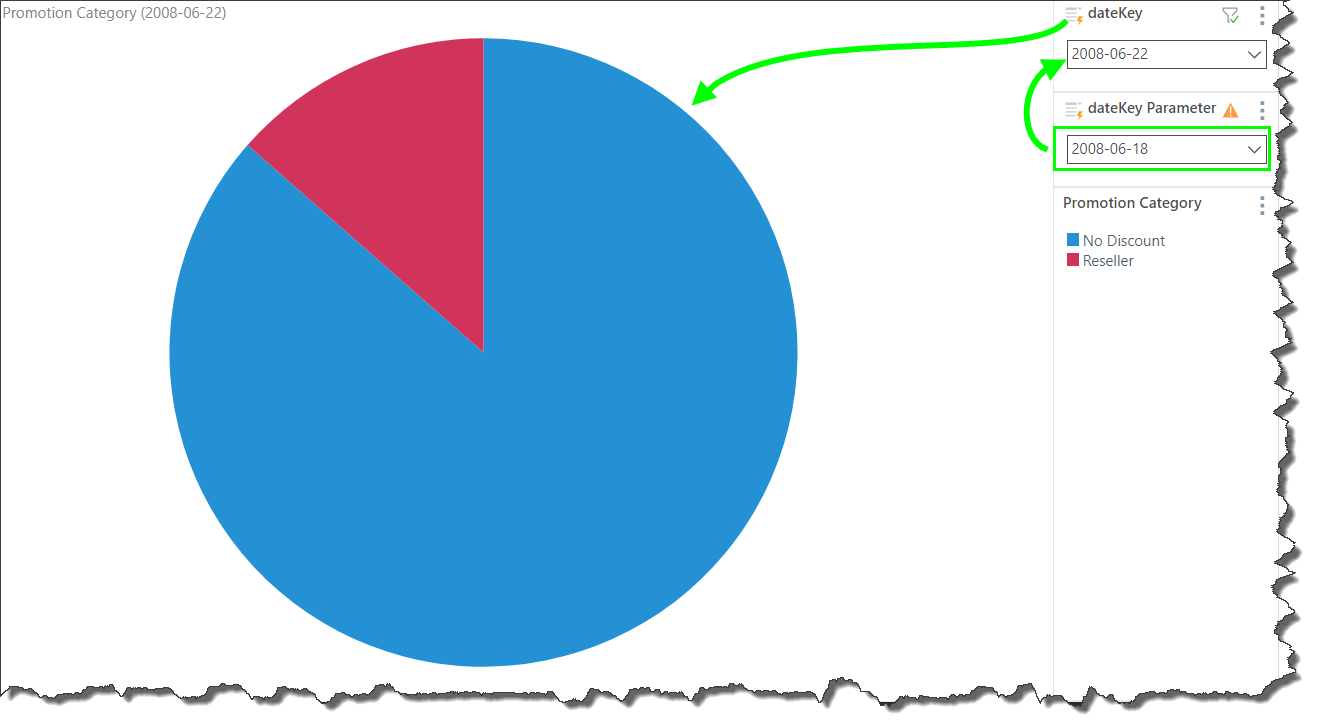
When the next slicer is opened, it displays all dates in Q2, 2008, in accordance with the date selected from the parameter slicer. A date must then be selected from this second date slicer in order to filter the visual:
The date selected from the second slicer was 22 June, 2008:
Current Period
Current Period selections show current period of the given level date/ time hierarchy.
- Current DateKey Year: shows the current year; available for the Quarter hierarchy.
- Current DateKey Quarter: shows the current quarter; available for the Year hierarchy.
- Current DateKey Week: shows the current week; available for the Week hierarchy.
- Today: display today's date. Available from the dateKey hierarchy and from the 'full month name' time intelligence hierarchy.