You can easily filter your hierarchy selection to show specific information that you're interested in. For example, you may want to use a filter to find and show the top 25% of products, rather than including sales figures for every product. This makes the resulting visual easier to understand, especially if you also sort your filtered information into an appropriate order.
Unlike custom selections, where you limit the members of the hierarchy to those items that have been explicitly selected, this type of filter limits the members to those that conform to a particular filter type. For example, the top ten percent of manufacturers by, say, Costs. Filtering your hierarchy selections in this way allows you to pinpoint areas of both high and low ("under") performance.
Making a Filtered Selection
Before you begin
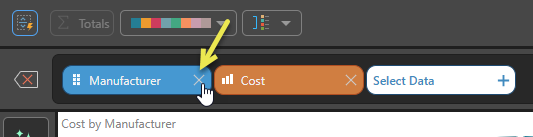
If you created a custom list following the instructions in that topic, you can start by removing the Manufacturer chip that represented your four Manufacturer elements:
Otherwise, create a new discovery and add a Cost measure.
Step 1: Locate a Hierarchy
To make a custom selection, start by finding the required hierarchy within its dimension:

Tip: You can use the search field to enter a search term and look for required items (in this case, the Manufacturers hierarchy) on the open tab.
Step 2: Define your filter
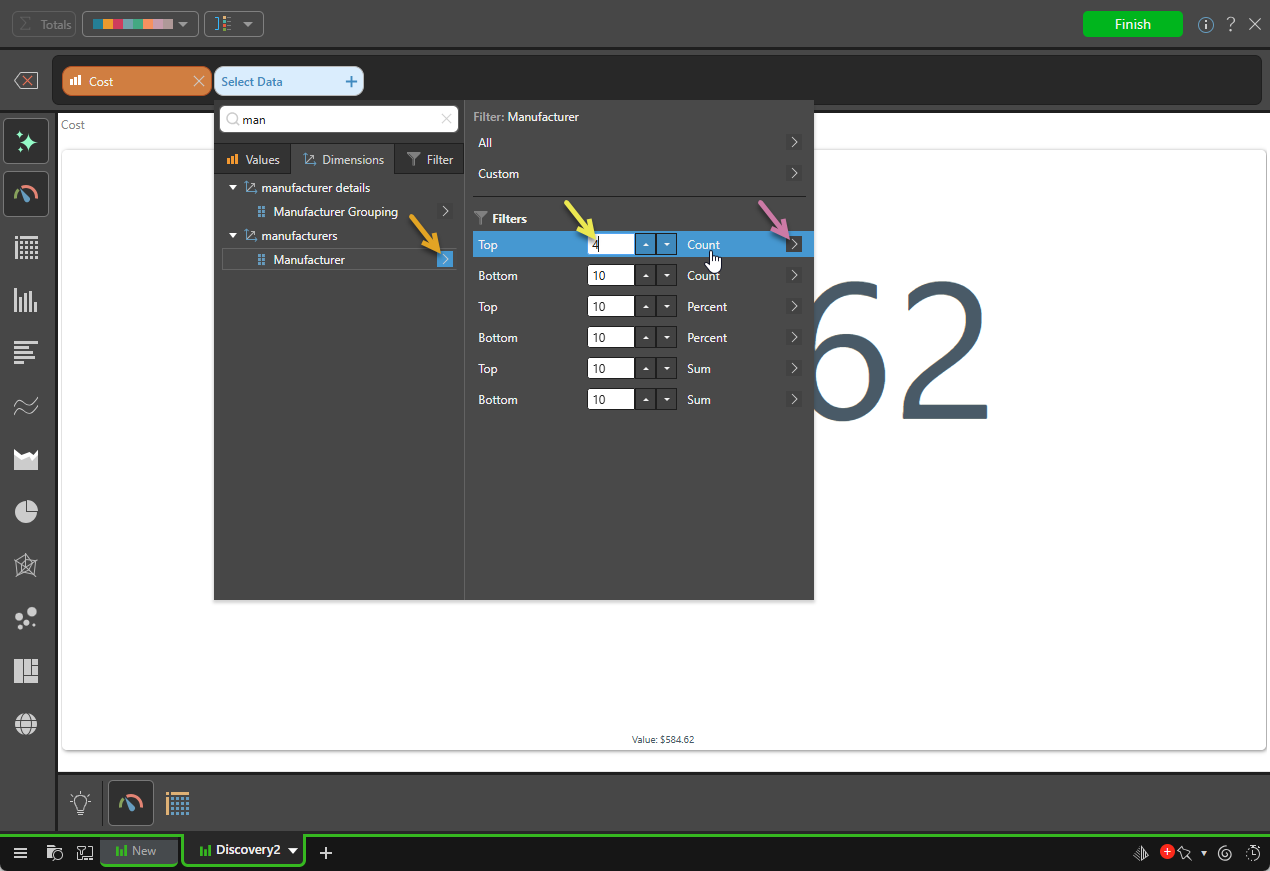
- Click the hierarchy's arrow to open its sub-menu (orange arrow below).
- In the main section of the Filter panel, select the type of Filter you want to apply and set its numeric value (yellow arrow).
- Once you've made your selections, double-click the Filter row to select it and add the filtered hierarchy to the discovery.
The Filter panel opens.
You can either type the number into the text field directly, or use the up and down arrows to increase or decrease the current value.
This example shows how the configuration appears if you want to select the top four (Count) Manufacturers. For details of the options in this list, see Filter Types (below).
Sort the Result
On the preceding example, there is an additional arrow alongside the name of the hierarchy (purple arrow above). Click this arrow to open the Sort sub-menu, where you can dictate how to sort your elements (alphabetical, reverse alphabetical, and so on). For more information about sorting filtered hierarchies, see Sorting Hierarchies in Smart Discover.
Result
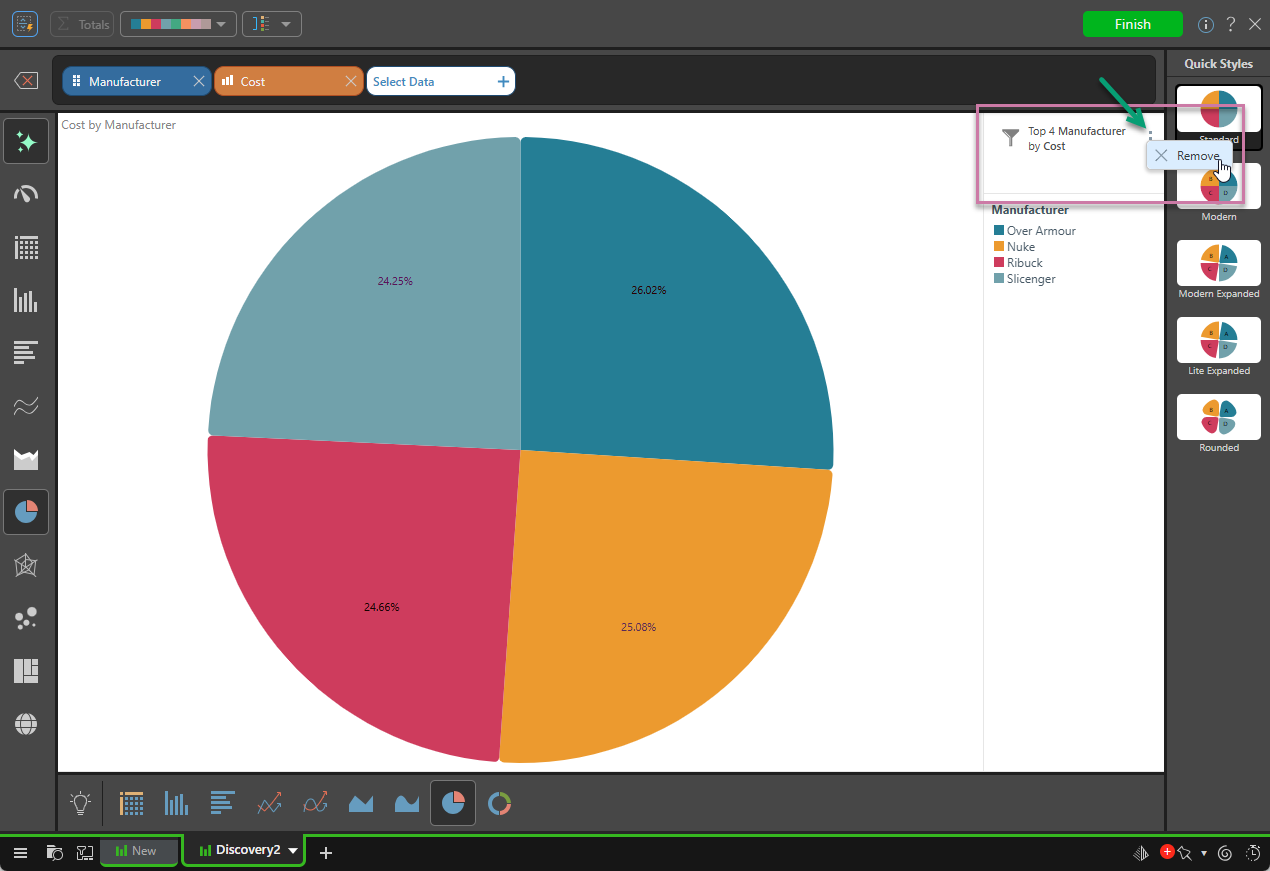
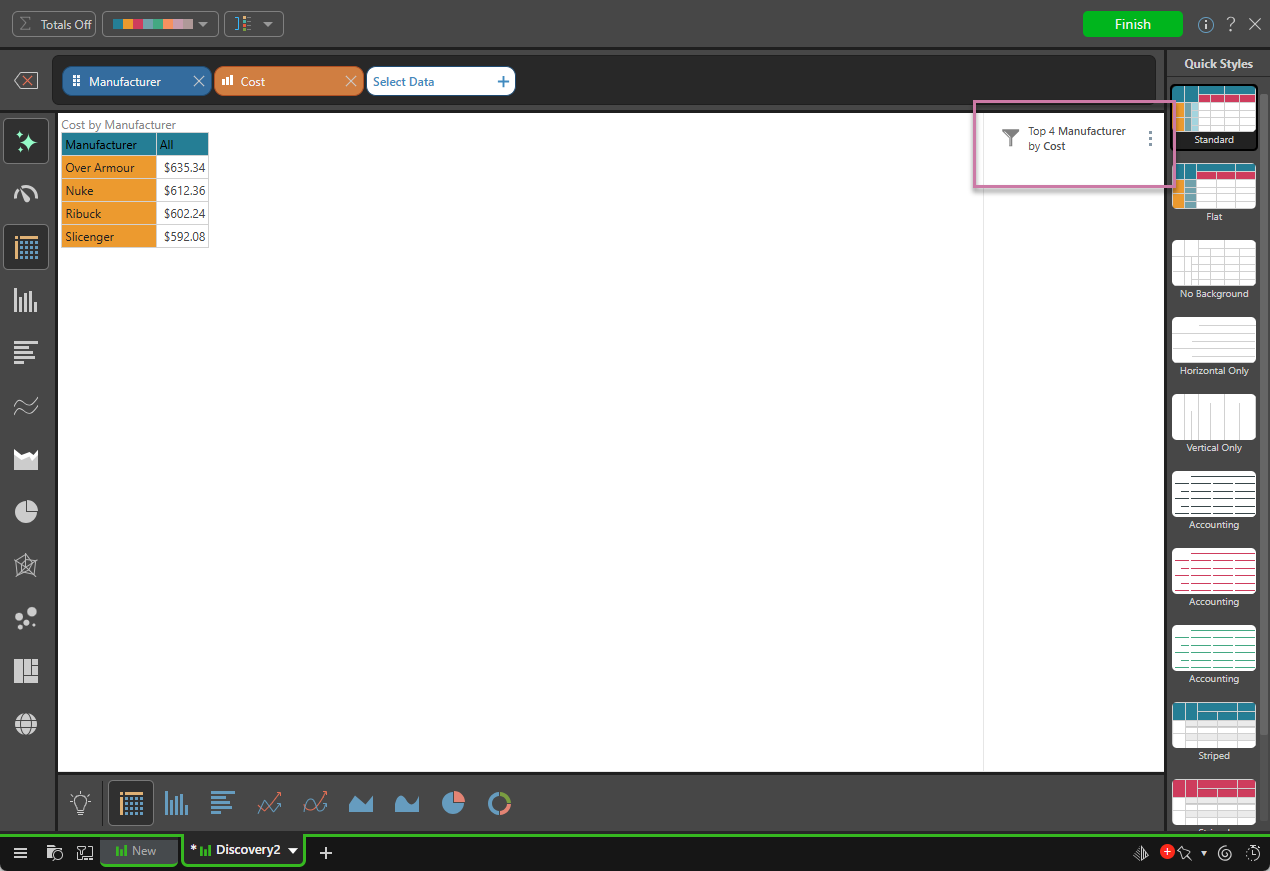
The Manufacturer chip is added to the Select Item bar and the top four filtered selections are added to the discovery. Note that, where the hierarchy includes a filter, a Filter caption is added to the canvas (purple highlight below):
Filter Caption
Where your discovery is filtered, a Query caption is added to the canvas that describes the filter in natural language. This provides information for the user to help them understand the underlying filtering.
Sort Caption
Where your discovery is also sorted, a Query caption will be added to the canvas that describes the sort in natural language. This provides information for the user to help them understand the underlying sorting. For more information, see Sorting Hierarchies in Smart Discover.
Query Captions
You can reposition, move, and resize the Sort or Filter captions using drag and drop. You can also remove them from the query, using the Remove option on their context menus ("ellipsis"). It is important to note that removing the caption also removes the sorting or filtering. For more information, see Layout and Captions.
Filter Selections
To add a filter, enter the required numeric value and click the filter.
Filter Types
There are three filter types to choose from: Count, Percent, and Sum.
Count
Select the top or bottom number of elements. For example, the top 5 elements or the bottom 10 elements.
The main example in this topic uses Top Count to display the top 4 manufacturers. Changing the Visualization Type to Matrix Grid causes the discovery to appear as follows:
The following example uses Bottom Count to display the bottom 4 manufacturers:

Percent
The top or bottom percent of elements. For example, the top 10% of elements or the bottom 20% of elements.
Top Percent was configured to display the top 25% of manufacturers:
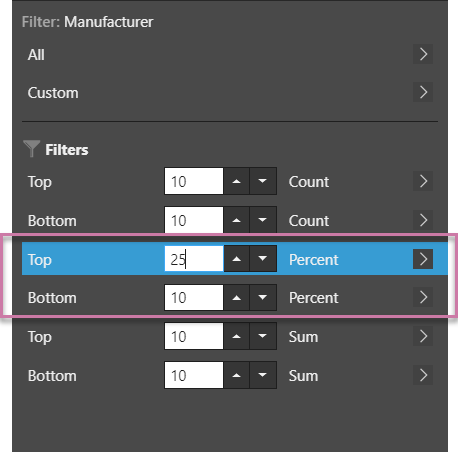
These elements make up the top 25% of manufacturers by cost:

Here, Bottom Percent was used to show the bottom 10% of manufacturers by cost:

Sum
The top or bottom elements that "sum" to the given value. For example, the top selling elements that accounted for $5,000,000 in sales, or the bottom selling elements that accounted for $2,000,000 in sales.
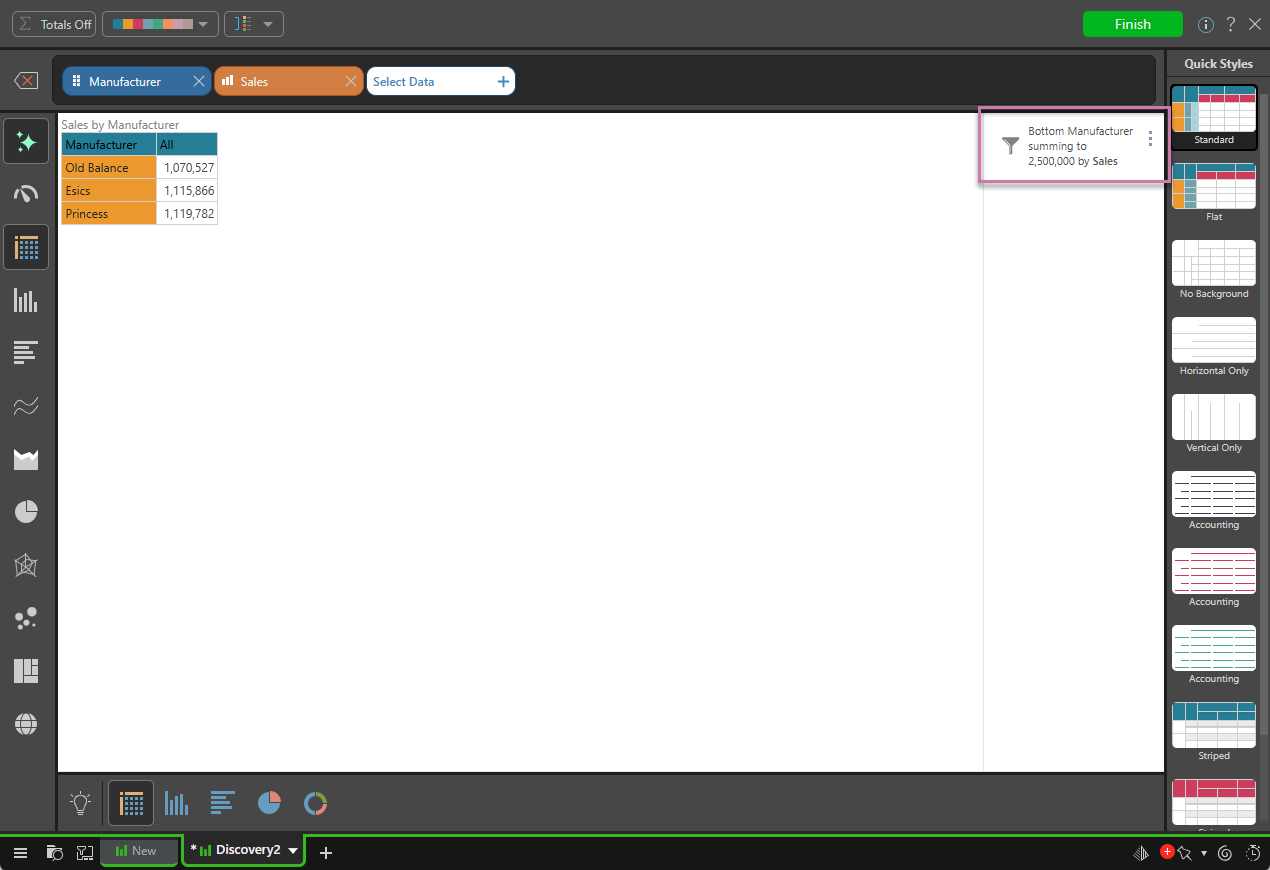
The Top Sum filter was configured to show the top selling manufacturers that accounted for $2,500,000 in Sales:
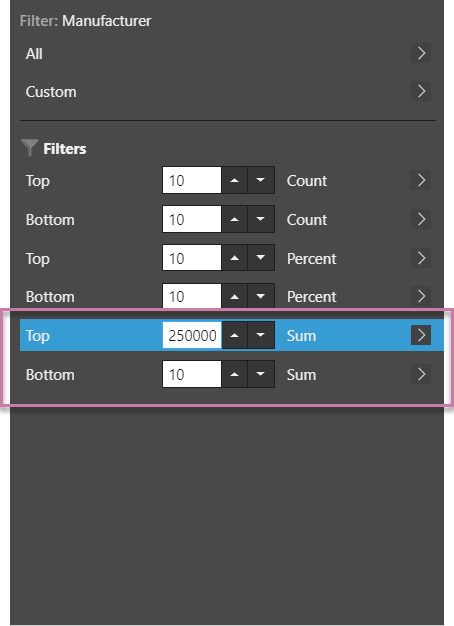
The combined Sales of these two top-selling manufacturers sum to 2,500,000:

Here, the Bottom Sum filter was used to find out which bottom-selling manufacturers accounted for $2,500,000 in sales: