The Smart Discover workspace includes an item selection bar, visualization picker, design panel, the visual canvas, quick styles, and automatically recommended items.
Example Smart Discover Workspace
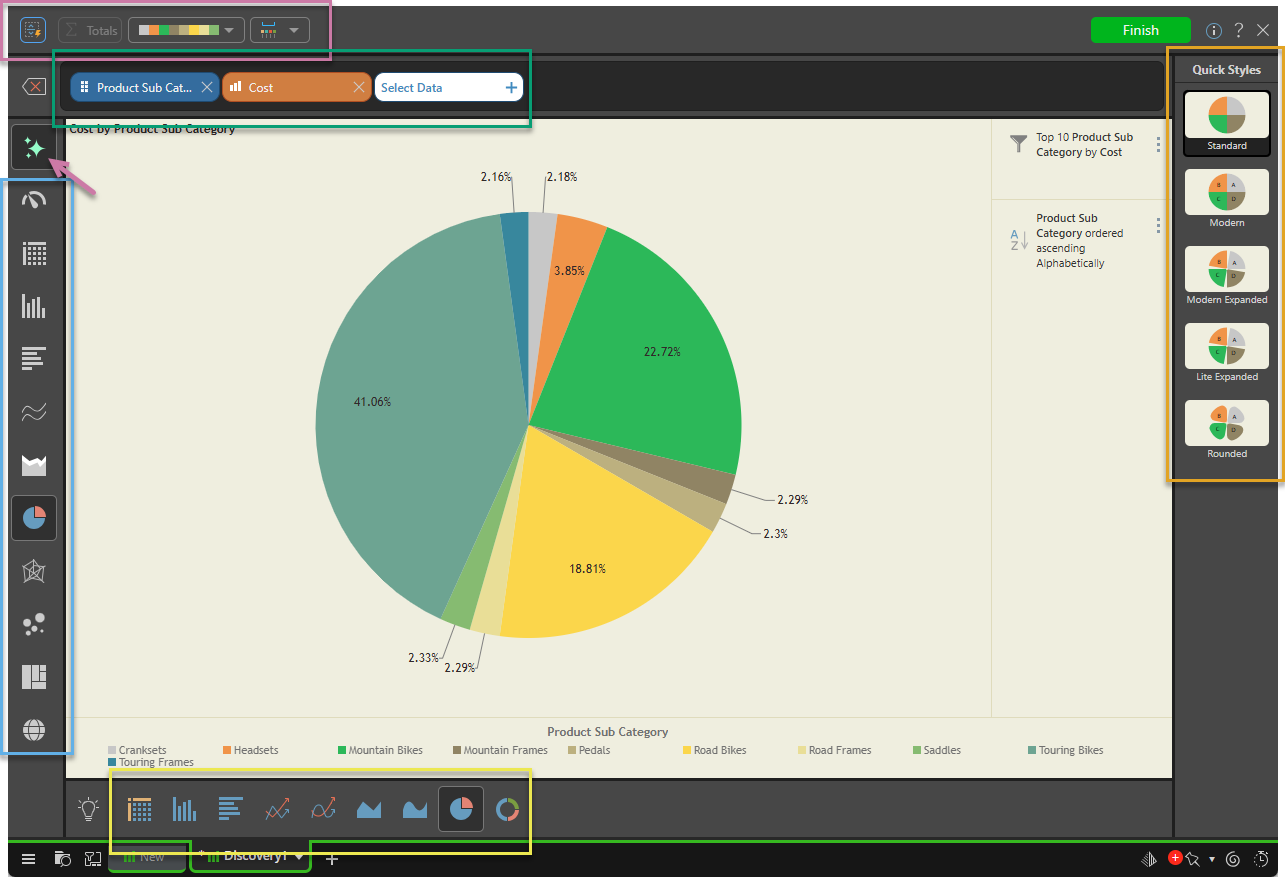
Item Selection Bar
The item selection bar (green highlight above) is located along the top of the canvas. This is where you construct visualizations by selecting the required Measures, Hierarchies, and Filters that you want to include on your visual.
Visualization Picker
The visualization picker or toolbox (blue highlight) is located along the left side of the canvas. From here, you can select a visualization type that you believe is best suited to represent the data in the query.
Auto Recommend
If you don't want to use the picker, you can:
- Click Auto Recommend (purple arrow) to have Pyramid select the best visual for you.
- Select a visualization type from the generated "best options" shown in the Auto Recommended panel at the bottom of the page (yellow highlight). This option is only available when Auto Recommend is enabled. For more information, see Auto Recommended Visualizations in Smart Discover.
Design Panel
The design panel (purple highlight), above the item selection bar, offers several important functions to help you design and format your visualizations as needed.
Visualization Canvas
The visualization canvas is where your visual is drawn as you select data in the item selection bar. The data is displayed in the form of the selected visualization type, along with any legends, filters, or slicers.
Quick Styles
The quick styles panel (orange highlight) offers some "preset" design palettes that consist of a few formatting and design options that you can apply in one go. Note: To see the effect that each preset Quick Style will have on your visual, you should hover your cursor over it to open its information panel.