Add existing analytic content (visuals from Discover, visual areas from Tabulate, infographics from Illustrate, and so on) to your presentation from the content management system or from the other slides in this presentation. You should try, as far as possible, to reuse content items in this way to ensure that you are always including the latest underlying analytic data from your team.
The visuals that you add to your presentation when you follow this process were created by you or other users using the Pyramid apps and saved to a shared location in the content management system. You must have access to the shared location to be able to select and add existing visuals.
As an alternative option, you might want to create and add a brand new "one-off" visual that only exists within this presentation. For more information, see Adding Visuals and Analytic data in Present Pro.
Adding existing visuals
Before you begin
You or your colleagues need to have already created the visuals that you want to add to your slide either in one of the other apps, or in this presentation. To be available in the Content panel the visuals must be available in the content management system in locations that you have access to, and may include existing:
- Visuals, created in Discover.
- Visual areas, defined in a Tabulate spreadsheet. Note: You cannot add a whole spreadsheet to your presentation, only specific visual areas.
- Infographics, created in Illustrate.
- Parameters, created in Formulate.
You also need to have created the presentation that you want to add your visual to. For details, see Building a New Presentation in Present Pro.
Add your visual
You have two options that you can follow to add an existing content item to your presentation: You can use the Content panel to navigate to and select the content item (or content sub-item) that you want to add to your presentation or, if you have your content item open in the editor, you can drag and drop it into the presentation from the App tabs.
Create or select a slide
Select the slide to add your visual to:
- From the Slides panel, click the Slide snapshot.
Tip: You can also add a new slide by clicking the Plus (+) icon at the top-right of the Slides panel.
The slide opens on the canvas in the middle of the page.
Content panel
- From the left-hand Content panel, search for or navigate to your visual:
- Do one of the following:
- Drag the whole content item (green arrow) from the content tree onto your canvas.
- Open the submenu and drag one of the sub-content items (yellow arrow) from the content tree to the canvas. These items include the main visual, its legend, and its slicers and the icons for each indicate its item type.
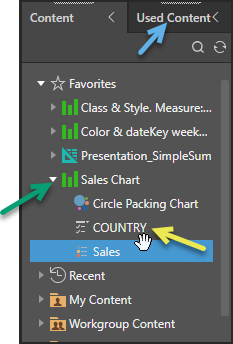
The visual is drawn on the canvas.
Tip: If your visual is used on a separate page of this presentation, you can add it from the Used Content panel (blue arrow) instead.
App tabs
Note: You can only add a visual to your presentation following these steps if it has been saved to the content management system already.
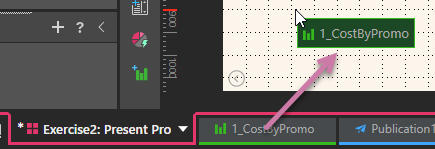
From the App Tabs along the bottom of your page:
- Drag the tab that represents the visual you want to add onto the presentation:
What next?
Once you have added your visual, you might want to:
- Resize your visual: Select the panel and drag its handles to fit the space.
- Rename your visual: Right-click the panel, select Rename Title, and supply a new title.
You might also want to add additional content items to the canvas, including additional visuals, text, shapes, images, and so on.