Select this option to arrange your members and measures into columns only. The tabular grid is similar in appearance to the raw results grid; however, it enables more flexibility in terms of formatting. Like the matrix grid, also exposes the Color, Size, and Tooltip drop zones; these drop zones are not exposed when working with raw results grids.
Tabular Grids
Building a Tabular Grid
Step 1: Create an Initial Grid
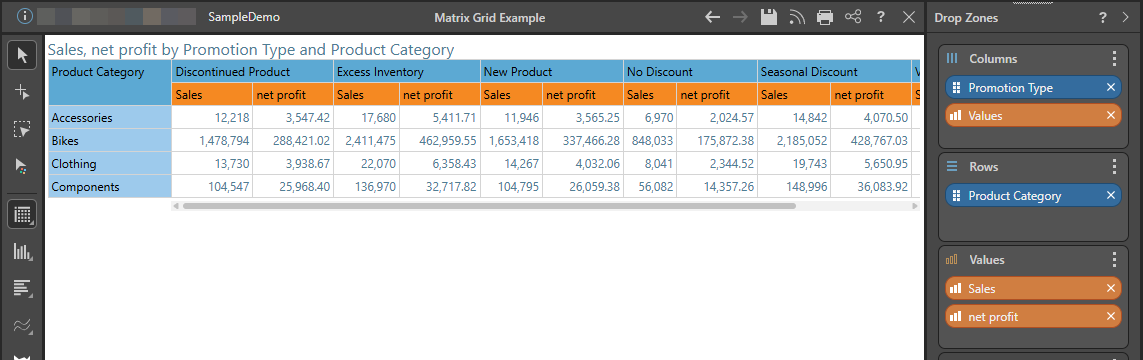
In the first instance, add the required hierarchies to the Columns drop zone, and the measures to the Values drop zone creates a Matrix Grid:
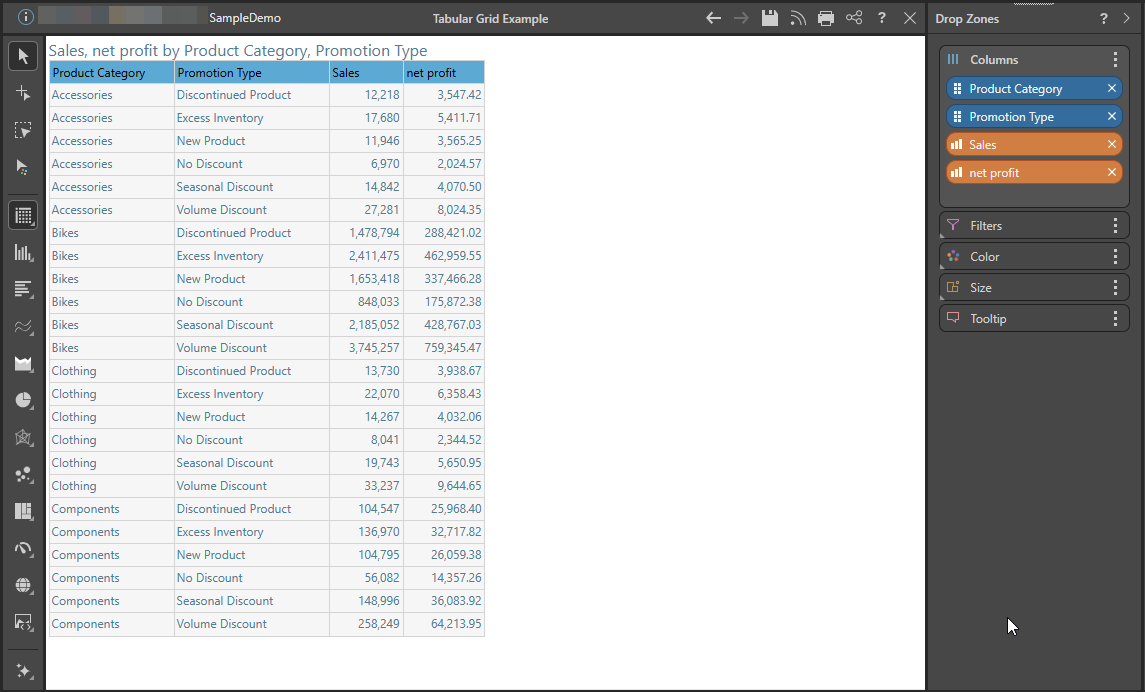
Step 2: Change to a Tabular Grid
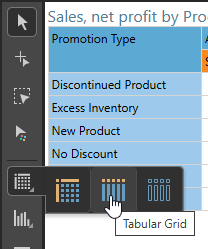
Select Tabular Grid from the Toolbox:
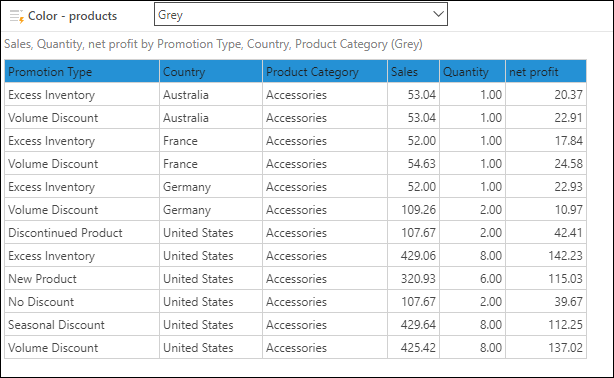
Each chip is represented as a column in the grid:
Step 3: Add Metadata
Add metadata to the other drop zones as required.
In the following example:
- The Country hierarchy was added to the Filter drop zone to create the country slicer at the top of the canvas.
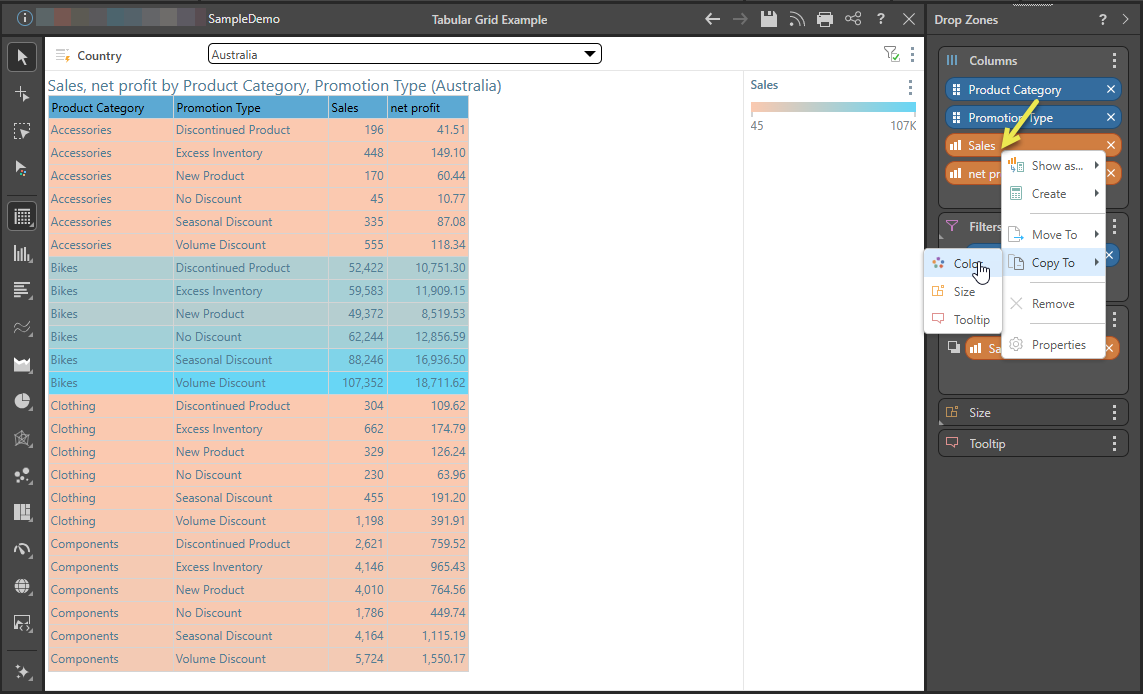
- The Sales measure was copied to Color (right-clicking the Sales chip in the Values drop zone), creating a color indicator that's driven by sales.