When a hierarchy or measure is added to the Color or Shape drop zone, a corresponding legend is automatically added to the canvas. Not only can you change the formatting of these legends, but you can also edit the formatting for the legend's individual elements or values (this is called series editing).
Legend Formatting
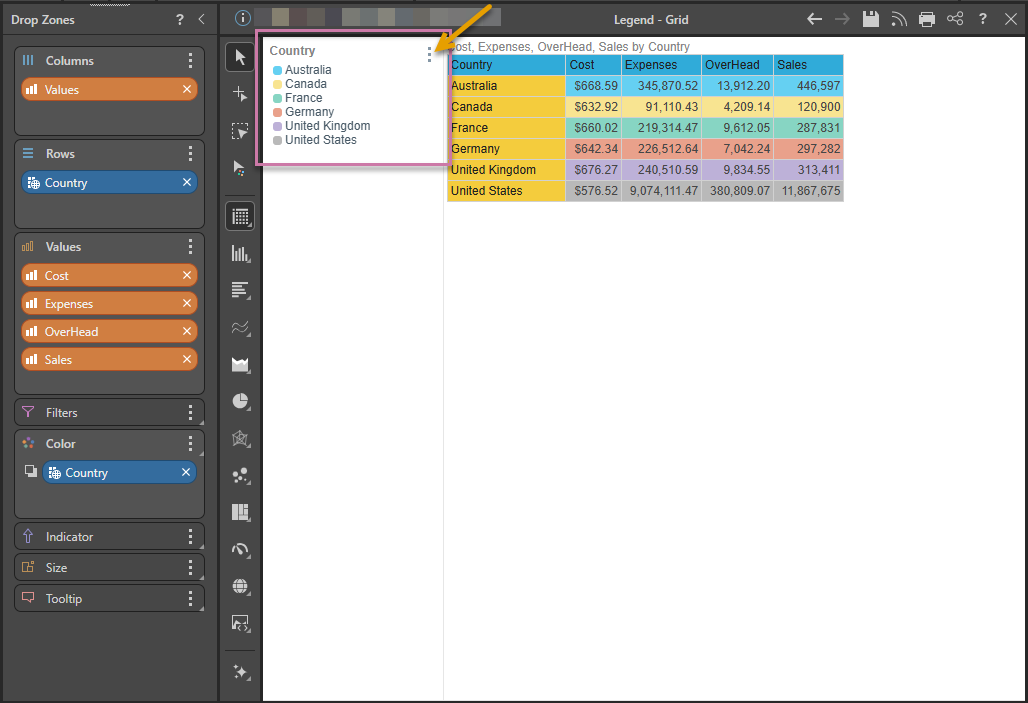
A legend is automatically added to the canvas when a hierarchy or measure is added to the Color drop zone, whether you're working with charts or grids:
You can change the look and feel of the Legend by adjusting fonts, layout, position, and more:
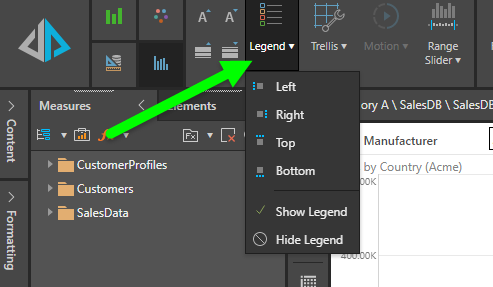
- You can change the legend's font and layout and re-position the legend on the canvas (to the right, left, top, or bottom) from the Formatting panel (see details below).
- You can also reposition the legend by dragging and dropping it using its handle (orange arrow above).
- You can show or hide the legend by selecting Hide from the legend's context menu (also orange arrow), or by selecting the required option from its dropdown menu on the Component ribbon.
Note: Any customizations made to the legend will be retained when the discovery is added to presentations and publications.
Legend formatting can be applied from the Formatting panel or the Legend dropdown menu in the Component ribbon.
Opening the Formatting Panel
You can access the Legend Formatting panel in the following ways:
- Select the legend on the canvas using the formatting selector.
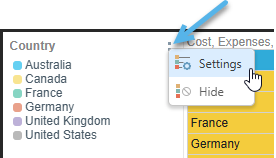
- Click Settings from the legend's context menu (blue arrow below).
Tip: If the Formatting panel is already open, you may need to select Legend from the main dropdown list at the top of the panel to see the Legend options.
Important: When you apply a fill color or pattern to the Shapes in your chart, the change appears both on the shape and, where applicable, in the legend. For example, a dotted pink column in a column chart will have a matching dotted pink legend marker. You can set the fill color and pattern for shapes by selecting Color in the Formatting panel.
Legend Options in the Formatting Panel
The following shows the options that you may see in the Formatting panel when you are changing the appearance of a legend. It is important to note that the formatting settings are slightly different for Discrete legends (legends containing individual color markers) and Continuous legends (legends showing a gradient representing a transition between values). For more information about these different types, see Legends.
Settings
The Settings formatting options (green arrow below) are used to adjust the position of the legend on the canvas, the alignment of the legend text, and, for discrete legends only, the layout of the columns (purple).
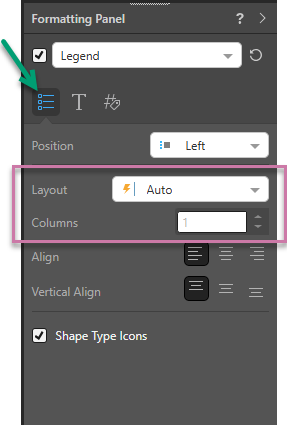
Position
Position the legend at the top, bottom, right, or left of the canvas.
Layout
- Layout: (Discrete legends only.) Change the legend's layout.
- Auto: When the legend panel is moved to the top or bottom of the canvas, the Number of Columns setting is overridden to automatically display the legend according to the best fit of element labels within the legend panel.
- Fixed: Manually set the number of columns into which the legend elements will be divided.
- Wrap: Wrap the legend. This option will display only one column.
- Columns: (Discrete legends only.) This option is enabled when the Fixed layout is selected. Use it to determine the number of columns to split the legend elements into.
- Align: To position the label horizontally, click the left, center, or right button.
- Vertical Align: To position the label vertically, click the top, middle, or bottom button.
Shape Type Icons
Only shown where shapes are used to represent data points. Select the Shape Type Icons checkbox to make the icons in the legend match the Type (Fill, Semi-filled, Empty) used for the Shape. For example, if this checkbox is selected and Fill is selected from the Shape's Type dropdown list, both the Shape and its Legend item are Filled.
Tip: You can see an example of the "semi-filled" style being used for shapes and reflected in the Legend (due to this feature) in the Lines with Shapes example.
Title
The Title formatting options (green arrow below) are used to adjust the title of the legend including its font settings and the separator under the title. These options are the same for both discrete and continuous legends.
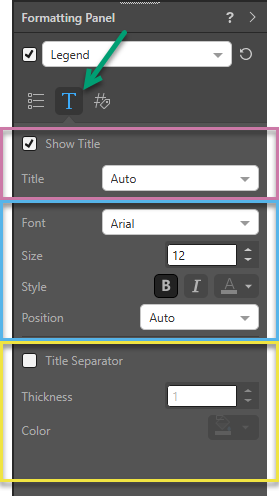
Show Title
- Show Title: Show or hide the legend title.
- Title:
- Auto generates a title according to the hierarchy or measure in the legend.
- Custom lets you add your own custom title.
Title Font
- Font: To use a different font style, click the arrow next to the default font and choose your desired font.
- Size: To incrementally increase or decrease the font size, click the Increase or Decrease arrows. Otherwise, type the font size you want into the text box.
- Style: Use the Style options to make the text Bold or Italic. To change the font color, click Font Color (letter 'A' with a colored underscore) and select your required color.
- Position: To change the position of the title:
- Auto: Let Pyramid position the title automatically.
- Horizontal: Position the title horizontally along the first line of the legend's elements.
- Top Start: Position the title above the legend's first line of elements, on the left side.
- Top Center: Position the title above the legend's first line of elements, in the middle.
- Top End: Position the title above the legend's first line of elements, on the right side.
- Legacy: Apply the legacy position from BI Office.
Title Separator
- Title Separator: Add a line underneath the title.
- Thickness: Change the thickness of the title separator.
- Color: Change the color of the title separator.
Legend
The Legend tab (green arrow below) in the Formatting panel is used to adjust the font and other format options for the legend contents; that is, the items in the legend, rather than the title.
Basic
- Font: Change the font type of the legend's elements.
- Size: Change the font size.
- Style: Change the title font style - bold, italics, or color.
- Padding: (Discrete legends only.) Add padding between each legend element.
Radius
Apply a curve to the corners of the markers or bar used in your legend. Where your legend is discrete, the radius applies to each of the square markers in your legend. Where your legend is continuous, the radius applies to the single bar representing the color transition:
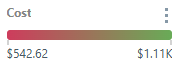
Where the radius is 0, the markers have right-angled corners. Increasing the radius adds a curve to the corners, making each marker or the bar into a rounded rectangle. The larger your Radius is, the more pronounced the curve is. For more information, see Roundness Options in Discover.
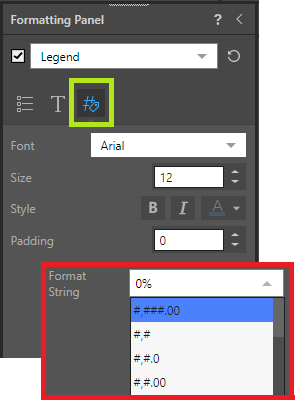
Format String
Continuous legends only, brown highlight above. Change the format string shown in the legend.
Gradient (Continuous only)
This option is shown when working with continuous legends only.
Tip: Where there are multiple legends on the discovery, you may need to choose the legend that you are formatting from the dropdown list above the formatting options (orange arrow below).
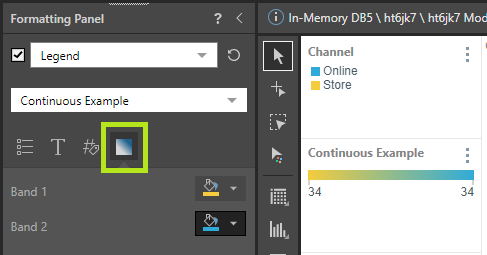
- Band 1: Choose the start color for the gradient using the Color Picker.
- Band 2: Choose the end color for the gradient using the Color Picker.
Component Ribbon: Legend Dropdown List
The Legend dropdown menu on the Component ribbon lets you show or hide the legend or change its position on the canvas:
Examples
Change the Legend Style and Position
In this example, the title was made bold and italicized, and a green title separator was added:
In this example, the legend was moved to the Top of the canvas, and the title position was changed to Horizontal. The font for both title and legend were changed to Verdana, and a green title separator was added.