When working with Matrix Grids, you can edit the overall design of the grid by selecting Matrix Grid from the drop-down in the Formatting Panel. You can also edit formatting for other components of the grid (like data, rows and columns, and report title) by choosing the relevant option from the drop-down menu.
Matrix Grid Settings
The Matrix Grid settings allows you to edit label formatting, borders, and other elements like column size, grid padding, and alignment.
Labels
From the Labels tab, set the formatting for the cell contents for the entire grid:

- Font: To use a different font style, click the arrow next to the default font and choose your desired font.
- Size: To incrementally increase or decrease the font size, click the Increase or Decrease arrows. Otherwise, type the font size you want into the text box.
- Style: Use the Style options to make the text or numbers Bold, Italic, or to add an Underline. To change the font color, click Font Color (letter 'A' with a colored underscore) and select your required color.
- Align: To position the text horizontally, click the left, center, or right button. The text is aligned according to your selection. Alternatively, use auto align (lightning) to let Pyramid set the alignment.
- Vertical Align: To position the text vertically, click the top, middle, or bottom button. The text is aligned according to your selection. This is useful when working with text wrapping.
- Background Color: To change the background color, click Background Color and select your color using the color picker.
Border
Set the formatting for grid borders formatting from the Border tab:

- Borders: Use these fields to manage the appearance of your grid's borders.
- Show / Hide Borders: Toggle the border buttons to show or hide top, bottom, right, or left borders.
- Thickness: To incrementally increase or decrease the border width, click the increase or decrease arrows.
- Color: To change the color of the grid's borders, click the Border Color button to open the color picker.
- Table Handles: Use these fields to show an additional border at the top or bottom of the grid.
- Show / Hide Handles: Toggle the table handle buttons to show or hide the handles at the top or bottom of the table.
- Thickness: To incrementally increase or decrease the table handle widths, click the increase or decrease arrows.
- Color: To change the color of the table handle's borders, click the Border Color button to open the color picker.
- For more information, see Grid Borders.
Settings
From the Settings tab, determine the settings for column and row size, padding, and more:

- Total Formatting:Show or hide formatting for totals.
- Row Area Size: Customize the size of the total combined width of the row header columns for matrix grids.
- Column Size: Customize the size of the grid's columns.
- Show Alternate Rows: Use the alternate rows function to display every other row in the grid in a different shade.
- Expand Icons: Turn on "expand icons" for rows and columns.
- Grid Padding: Use grid padding to increase the size of the space of gap between each column and row.
- Alignment: Use the Alignment tools to position the matrix grid on the canvas.
Miniature Colors
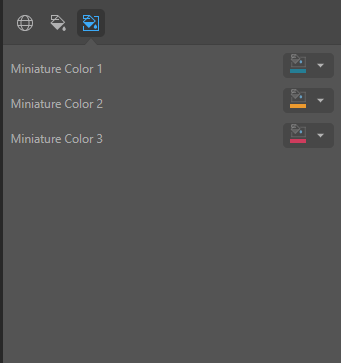
Click Miniature (purple arrow below) to specify the colors used for the text content when your visual is represented as a Miniature Visual:

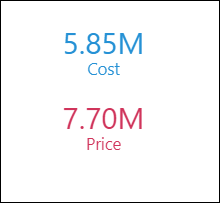
Miniature visuals are created automatically when you scale a visual down to a size that makes its content illegible. These tiles typically display the measure as a number with its name underneath:

Note: The purpose of a miniature visual is to provide a way to easily view and interpret important data at a glance, even where there is a lot of information and limited space.
You can use the Color Picker to set the text colors used when Miniatures are displayed in a visual:
- Miniature Color 1: Select the color for the first tile in the miniature visual (blue in the preceding example).
- Miniature Color 2: Select the color for the second tile in the miniature visual (red in the preceding example).
- Miniature Color 3: Select the color for the third tile in the miniature visual (not shown).
Other Settings for Matrix Grids
The following grid components can be edited by making the required selection from the main drop-down list in the Formatting panel.
- Report Title: Customize the report title.
- Data: Change the font type, size, color, emphasis and alignment for all data cells in the grid.
- Columns: Change the font type, size, color, emphasis and alignment for columns only.
- Rows: Change the font type, size, color, emphasis and alignment for rows only.
- Legend: Change the formatting associated with the legend.
- Color: Customize the color and font for a given legend item and the analogous data point.