Use the Select Lasso to select multiple items at once. This lasso type allows you to draw a boundary around your desired content, selecting all items that fall within a simple rectangle, circle, or "free form" shape. This tool is typically useful for making contiguous selections, since it allows you to "lasso" a set of data points or members. Once selected, an action can be applied to all items either by virtue of the selected action or on the right-click.
Important: The Select Lasso is available for all visualization types, but only incorporates the different configuration options where they are relevant to the visualization type. The configuration options are accessed on the right-click and determine the Shape (Free-Form, Rectangle, or Circle) and Action (Select, Focus, and Classify) for your lasso.
Select Lasso
You can use this tool to pick multiple, typically contiguous, data points on the canvas, perform the action associated with the selector (select, focus, or classify), and, optionally, right-click those selected items to access the context menus; for example, to Eliminate some cells or Focus on the members you have selected in the legend.
From 2025.02, the configurable Select Lasso is available for use in Grids. The submenu options for Grid lassos are the Select and Focus actions and Rectangle and FreeForm shapes. See below for details.
Enabling the Lasso
From the Toolbox:
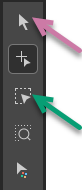
- Click Select Lasso (green arrow below).
Your cursor changes into a "multi-selection" tool (compass) allowing you to do one of the following:
- Drag your cursor across the data points to draw a Circle or Rectangle that selects the contained items.
- Draw your own shape "free-hand" on the canvas, selecting any items inside the shape.
Note: Typically, the action associated with your lasso is select. This means that the items inside your selection are selected and you can make use of the right-click context menus available for your given selection.
Advanced Submenu Options
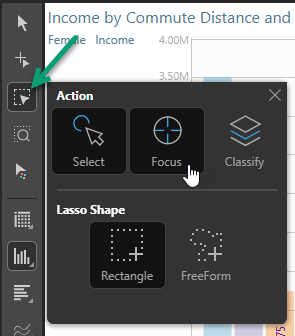
If you right-click the Select Lasso option (green arrow below) in the Toolbox, you may be offered the following advanced submenu options. Where this is the case, you are selecting (1) the Action to take once you have selected multiple options and (2) the Lasso Shape to draw when making your selection.
These selections are applied right away and also when the lasso is next used. If you no longer want to use classify, say, you will need to change the selected options on this menu.
Important: These right-click / advanced options are not available for some visualization types. For these visualization types, including Bullets, Box and Whisker Charts, and Gauges, the Select Lasso always applies the Select action and draws a Rectangle.
Action
The Actions describe what should happen once you have selected some items.
Select (Default)
Select the data points or, in the case of Legends, members inside your lassoed area. Once selected, you can access actions that are applicable to your selections on the right-click context menu.
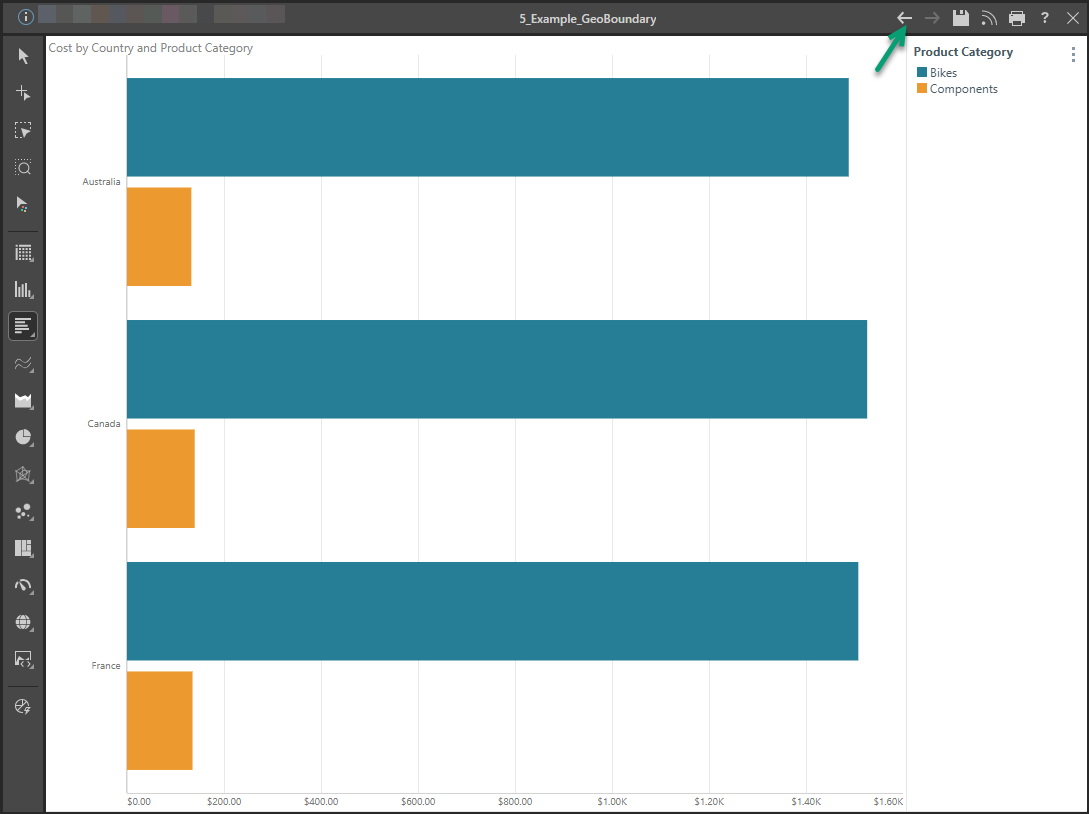
Focus
Clear all of the data points that are outside of your selected area. This makes your view less "noisy," allowing you to focus only on those data points you are interested in. You can access actions that are applicable to the data points you have "in focus" on the right-click context menu.
To clear your focus and add all data points back onto your visual, click Undo in the Status Bar.
Tip: If you only want to look at a small area of your diagram in more detail for your current task, you might want to use the Zoom Lasso instead. For more information, see Zoom Lasso in Discover Pro.
Classify
Classify your selected data points as being "in" a group and any other data points (those that are not selected) as being "out" of that same group. This option creates a one-off custom column in this visual, and adds it into your Dimensions panel for use in your drop zones; for example, to filter your map by countries in North America and countries that are not.
Note: Where your visual is a Shape or Bubble Map, your custom column is created as a Geo Boundary.
Lasso Shapes
The Lasso Shapes options describe the type of shape that you want to draw on the canvas when selecting your data points.
Rectangle
Selecting the Rectangle shape means that, when you drag your lasso across the items, you draw a rectangle shape. Everything inside the rectangle is selected.
Circle
Selecting the Circle shape (not shown above) means that, when you drag your lasso across the items, you draw a circle starting at the circle's center and moving outwards. Everything inside the circle is selected.
Note: The Circle option is typically not available for charts that make use of rectangular forms, including Column Charts and Bar Charts.
FreeForm
Selecting FreeForm allows you to draw a shape "free hand" that selects your data points. Unlike some drawing tools, you do not need to draw a "closed loop" using your FreeForm lasso. You simply click and, holding your mouse button, draw the shape or line, finishing your action when you release your mouse button. Anything that the line intersects, and any area that would be filled if you joined your first and last points (as indicated by the shaded area), is selected.
Making your selections
You select data points in your visual by dragging your cursor across the various items.
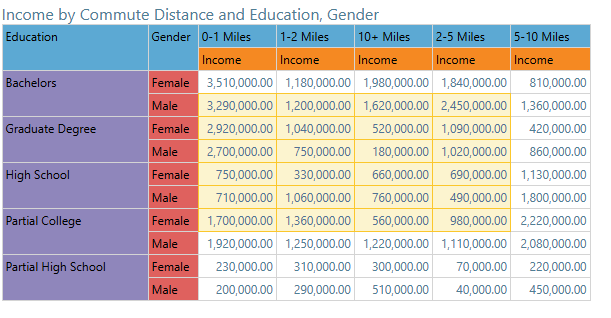
Grid
Grid selections are the simplest type. You can open the submenu described above and select Select and Rectangle for your lasso. Then, while you have the Select Lasso tool enabled in the Toolbox, you can select contiguous data points by dragging your cursor across them in the grid. Selected data points are shown with a yellow halo:
Once your items are selected, you can access actions applicable to your selections on the right-click context menu.
Step-by-step examples
From the Toolbox:
- Right-click the Select Lasso option (green arrow) and select the following:
- Action: Select.
- Shape: Rectangle.
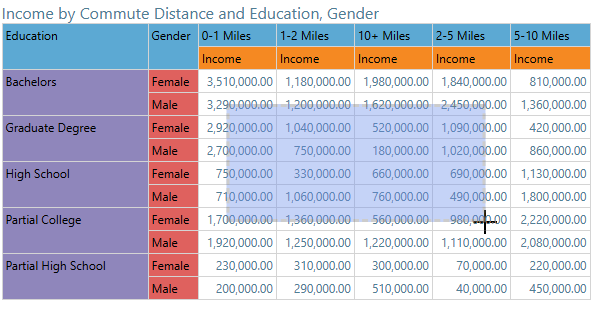
- Click the first item you want to select in the grid and, without releasing your mouse key, drag your cursor across the items that you want to select:
- Release your mouse key once the highlighted area covers the items you want to select. The selection is made:
You do not need to make these selections if you chose them the last time you used this lasso type. In that case, you can simply click the Select Lasso option in the Toolbox to enable it.
You can now choose the actions you want to perform on your selected cells using options on the right-click context menu.
The following example shows how to use the FreeForm Shape and Focus Action on the Select Lasso submenu to focus on the information in a bar chart about Bikes and Components in Australia, Canada, and France.
From the Toolbox:
- Right-click the Select Lasso option (green arrow) and select the following:
- Action: Focus.
- Shape: FreeForm.
- Click on the diagram where you would like to start selecting your data points. Hold down your mouse key as you draw a line that intersects and encloses any data points that you want to include in your selection:
- When everything you want to focus on is selected, release your mouse key. The selection that you made (Bikes and Components for Australia, Canada, and France) comes into focus.
- If you want to leave this focused view, you should click Undo in the Status Bar (green arrow above).
You do not need to make these selections if you chose them the last time you used this lasso type. In that case, you can simply click the Select Lasso option in the Toolbox to enable it.
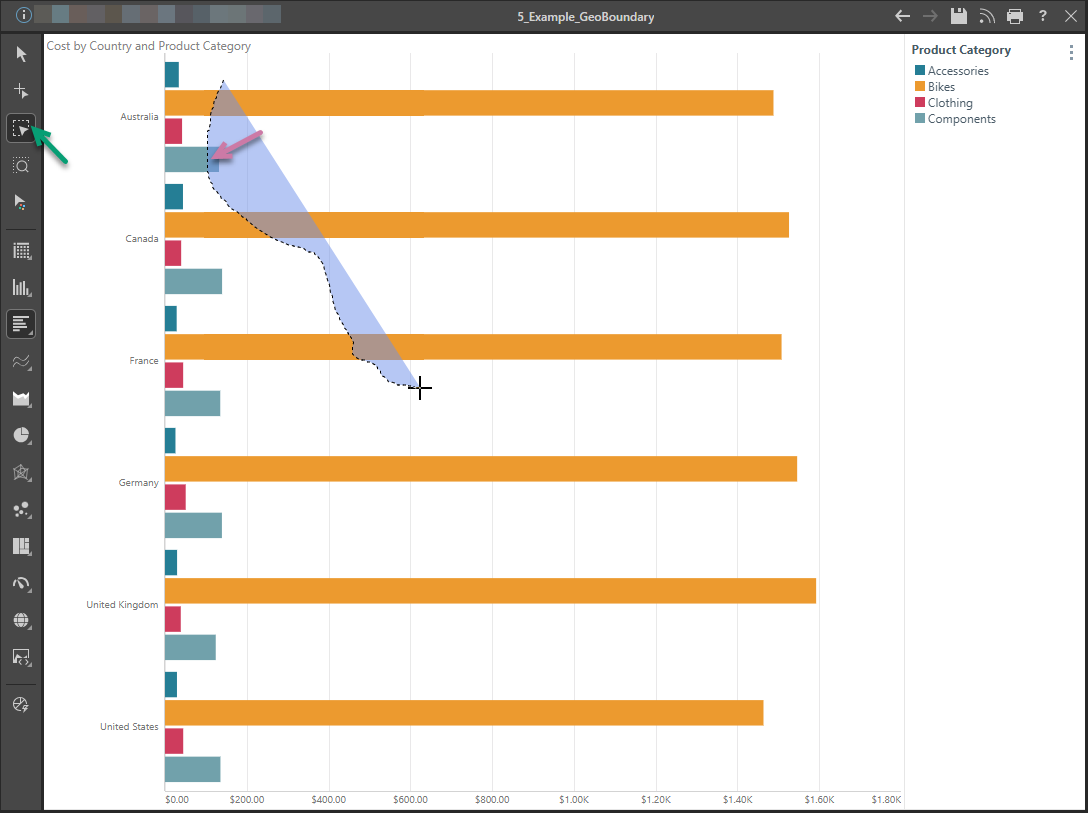
Note: The lassoed area is the line you draw (dotted) and any area that would be filled if you joined your first and last points (indicated by the shaded area). The purple arrow shows that there is one place where Components is selected.
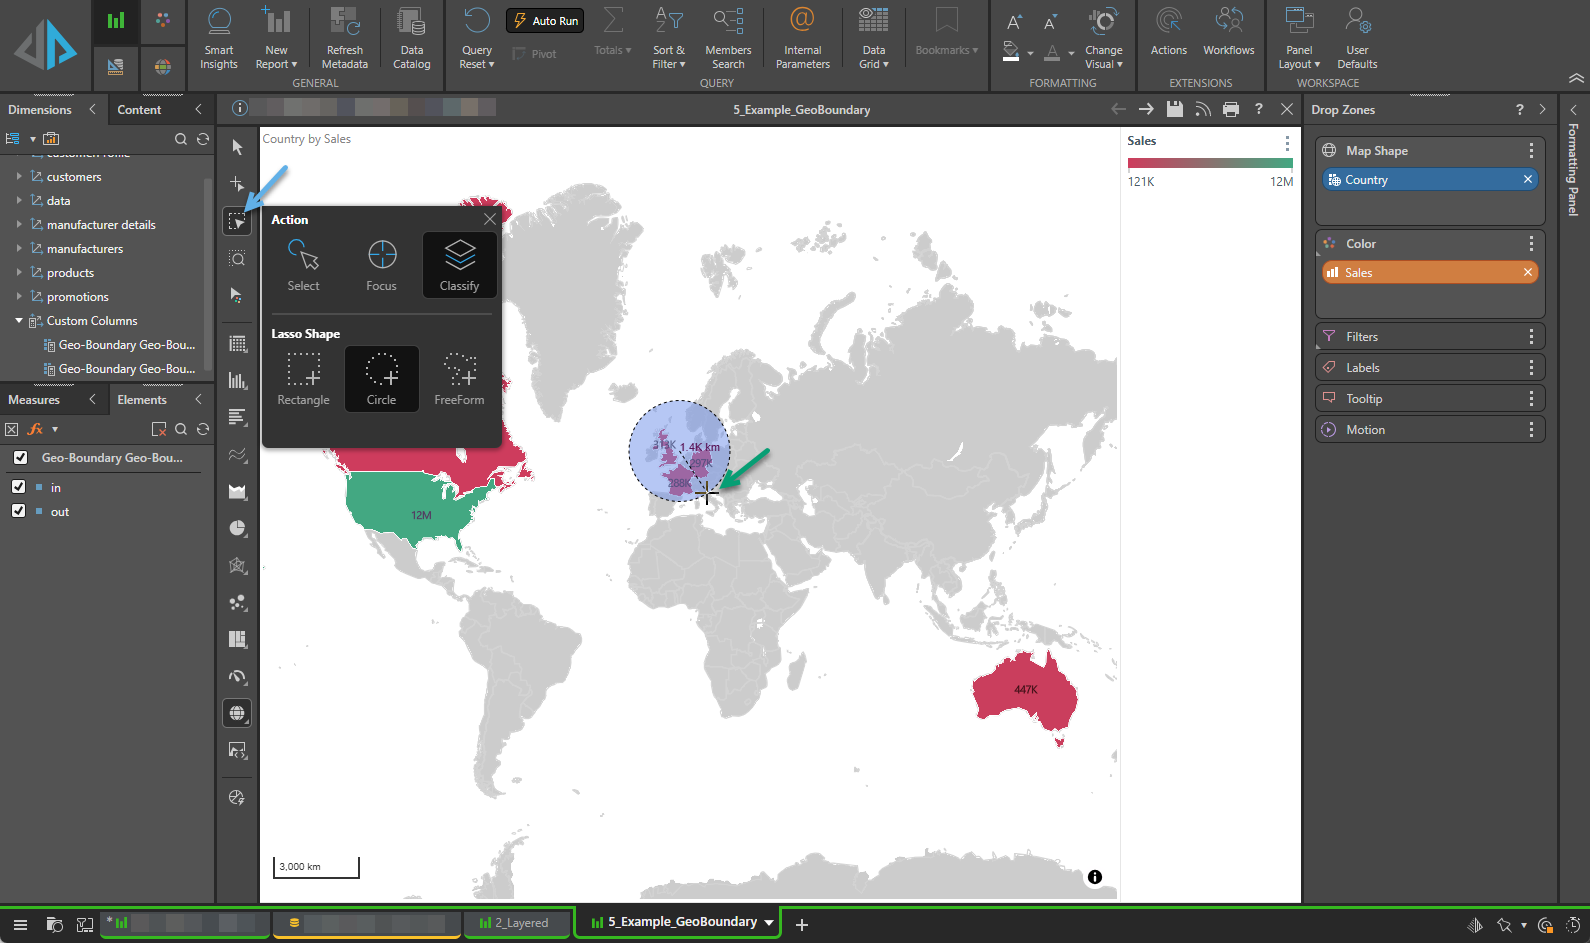
The following example shows how to use the Circle Shape and Classify Action on the Select Lasso submenu to create a "Geo Boundary." A Geo Boundary classifies selected items as being "in," while non-selected items are left "out."
From the Toolbox:
- Right-click the Select Lasso option (blue arrow below) and select the following from the options:
- Action: Classify - This option indicates that you are creating a custom column.
- Shape: Circle - This option indicates that you will select your data points using a circular selector.
- Click on the map in the middle of the countries you want to select and, without releasing your mouse button, drag your cursor outwards (green arrow).
- When you have reached the furthest data point that you want to select, release the mouse key.
You do not need to make these selections if you chose them the last time you used this lasso type. In that case, you can simply click the option in the Toolbox.
A circle is drawn as you drag your cursor outwards from its center. The selected countries are those that are inside the circle once it is drawn.
The Geo Boundary is created and added to the Dimensions panel with a name including the prefix "Geo-Boundary..." The chip is also added to Color drop zone by default, classifying the countries inside of the circle you drew as "in" and countries outside of the circle you drew "out."
- Click here for more information about Geo Boundaries
Related information
Which items are present on the right-click menus when you have multiple members or data points selected depends on your selections and your discovery's visualization type. For more information, see: