The Pyramid Content node can be used to bring Pyramid Discover reports into your Data Flow as your data source. You can select reports from any model and any folder location, so long as you have access to the folder and the report, and the underlying data source. In creating the report, the user can build any query logic they choose, from attribute and base measure selections, through to complex formulas and lists. The underlying visualization type used in the report (pie, scatter, and so on) does not matter.
Tip: There are several Pyramid options that you can set up as your data source. You can use discoveries (whose configuration is described in this topic), tabulations (that you can add as a data source following the steps in the Pyramid Content: Tabulate topic), and the local In Memory Database (that you can add as a data source following the steps in Pyramid In Memory Database).
Connect to Pyramid Discover Reports as a Source
Start by adding the Pyramid node to the canvas and go to its Properties panel.
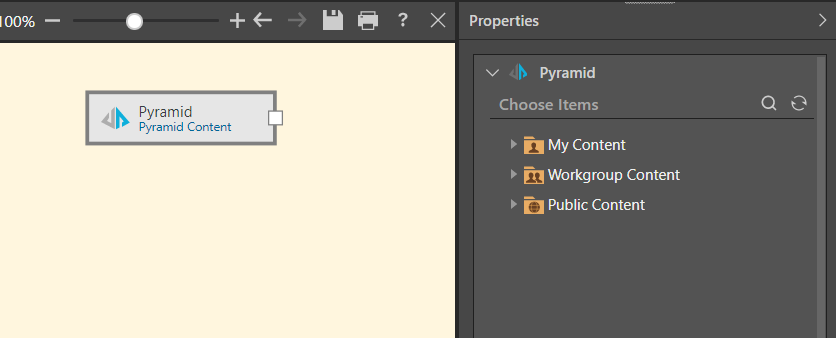
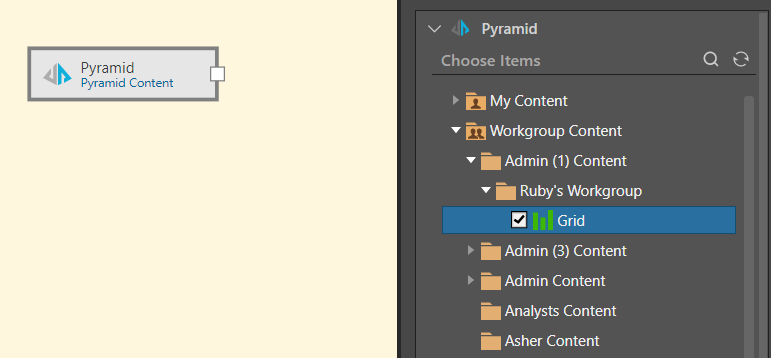
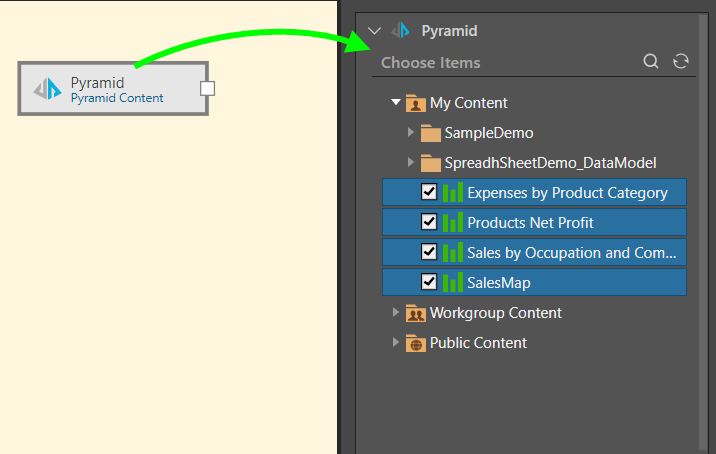
From the content tree, find and select the reports that you want to copy to the data flow. These can be in any folder that you have access to, and all visualization types are supported. You can select multiple reports from different folders and domains.
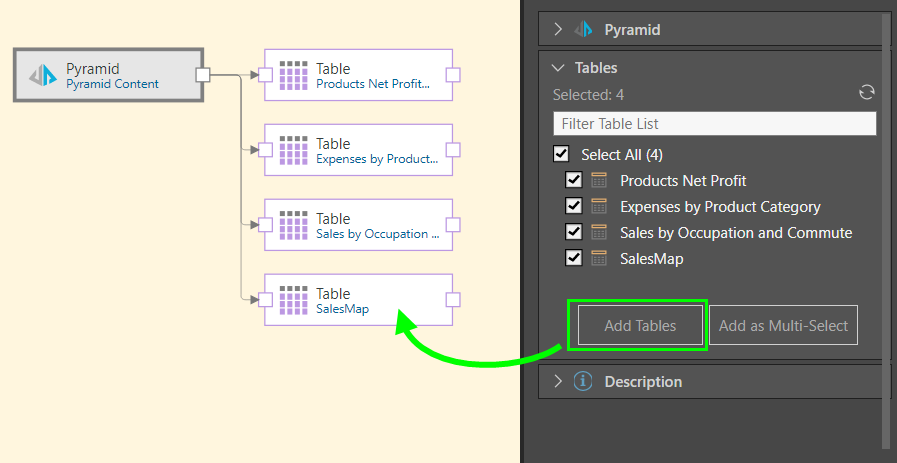
The selected reports will appear in the Tables selection, and may be added as table nodes or as a single multi-table node:
- Add Tables: This first option (orange highlight below) generates an individual Table node for each table; various other nodes can then be connected to the tables to perform data cleansing and manipulations.
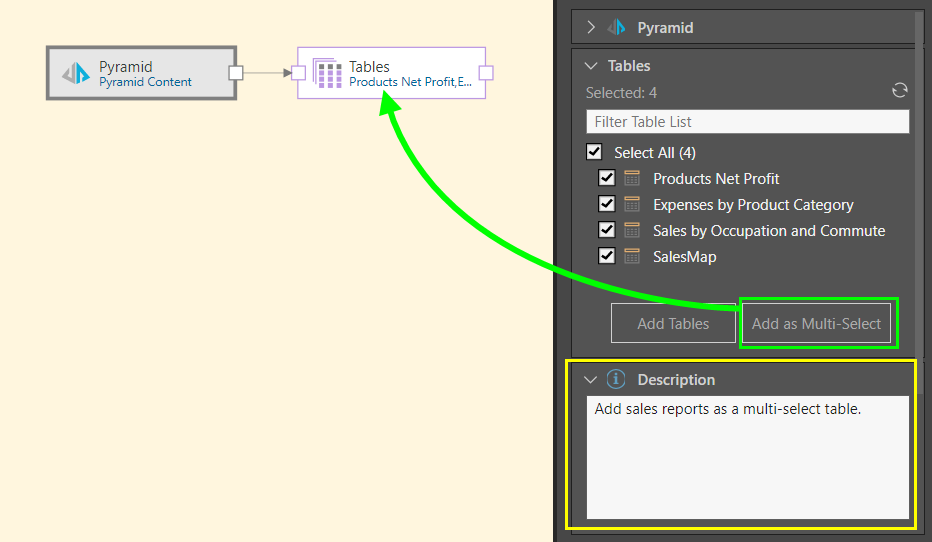
- Add as Multi-Select: This second option (green highlight) generates a single Tables node for all selected tables. This node can be connected directly to a Target node only.
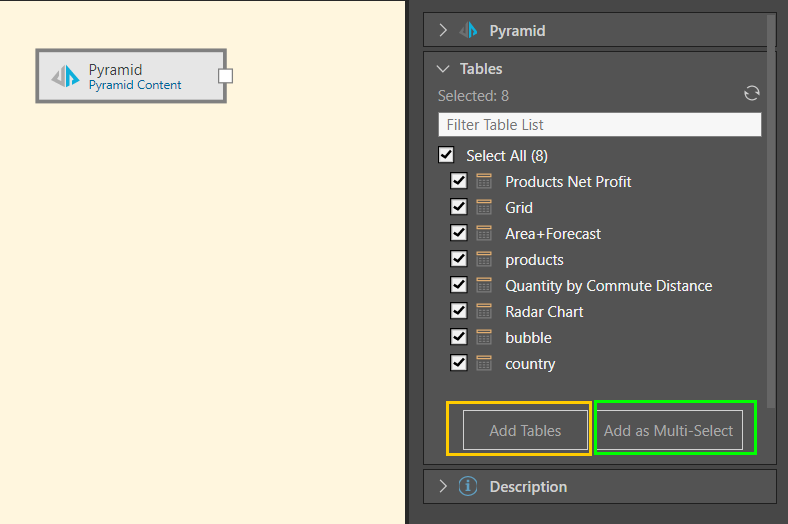
Table node configuration
Select each Table node on the canvas and specify optional configuration as follows:
-
If the table includes value-based filters, you can select the Ignore value-based filters checkbox to remove those filters for the new model. This makes the entire dataset available for further analysis.
In this example, the user added the Pyramid data source node to the data flow and selected four reports from the My Content domain in the content tree (green arrow below):
Next, these four reports were selected from the Tables window and added to the data flow using the Add Tables function, connecting each table to the data source via an individual table node (green arrow below):
In this example, four tables were selected from the content tree and then enabled from the Tables window. These tables were then added to the data flow using the Add as Multi-Select function, connecting the tables to the data source via a single multi-select tables node (green arrow below). The process was documented in the Description window for later reference (yellow highlight).