The Pyramid Content node can be used to bring Pyramid Tabulate spreadsheets into your Data Flow as your data source like Pyramid Discover reports. You can select Tabulate spreadsheets from any model and any folder location, as long as you have access to the folder and the file. If the spreadsheet includes live data (which it typically does), you also need access to the underlying data sources.
Tabulate spreadsheets can combine live data from multiple queries, across multiple data sources; blend values with spreadsheet formulas on top of any formulas built into the live data; and, embellish with static values that an end user can type into the spreadsheet.
This technique effectively offers a mechanism for end-users to capture changes in the spreadsheet and then have those changes written-back into the chosen database.
Note: Tabulate is separately licensed.
Tip: There are several Pyramid options that you can set up as your data source. You can use Tabulate spreadsheets (whose configuration is described in this topic), Discover reports (that you can add as a data source following the steps in the Pyramid Content: Discovery topic), and the local In Memory Database (that you can add as a data source following the steps in Pyramid In Memory Database).
Using Tabulate as a Data Source
Before you begin
Before you can model the Pyramid Content data source, you need a tabulation that is:
- Saved in the content manager in a folder that you have access to.
- Created with at least one visual area. The content inside the visual area (or discovery area) will be the target data that you pull into your tables, rather than the whole tabulation.
Note: Your tabulation may include data from an underlying discovery. Where this is the case, dragging the discovery data into your tabulation automatically creates a discovery area containing all that content.
Step 1: Add your Pyramid Content node
From the Data Flow page:
- Drag and drop the Pyramid Content node from File Sources onto the Data Flow canvas (purple arrow below).
- Select the Pyramid Content node on the canvas.
- Navigate to and select the tabulations (or the discoveries) that you want to add as your sources in the Properties panel (blue arrow above).
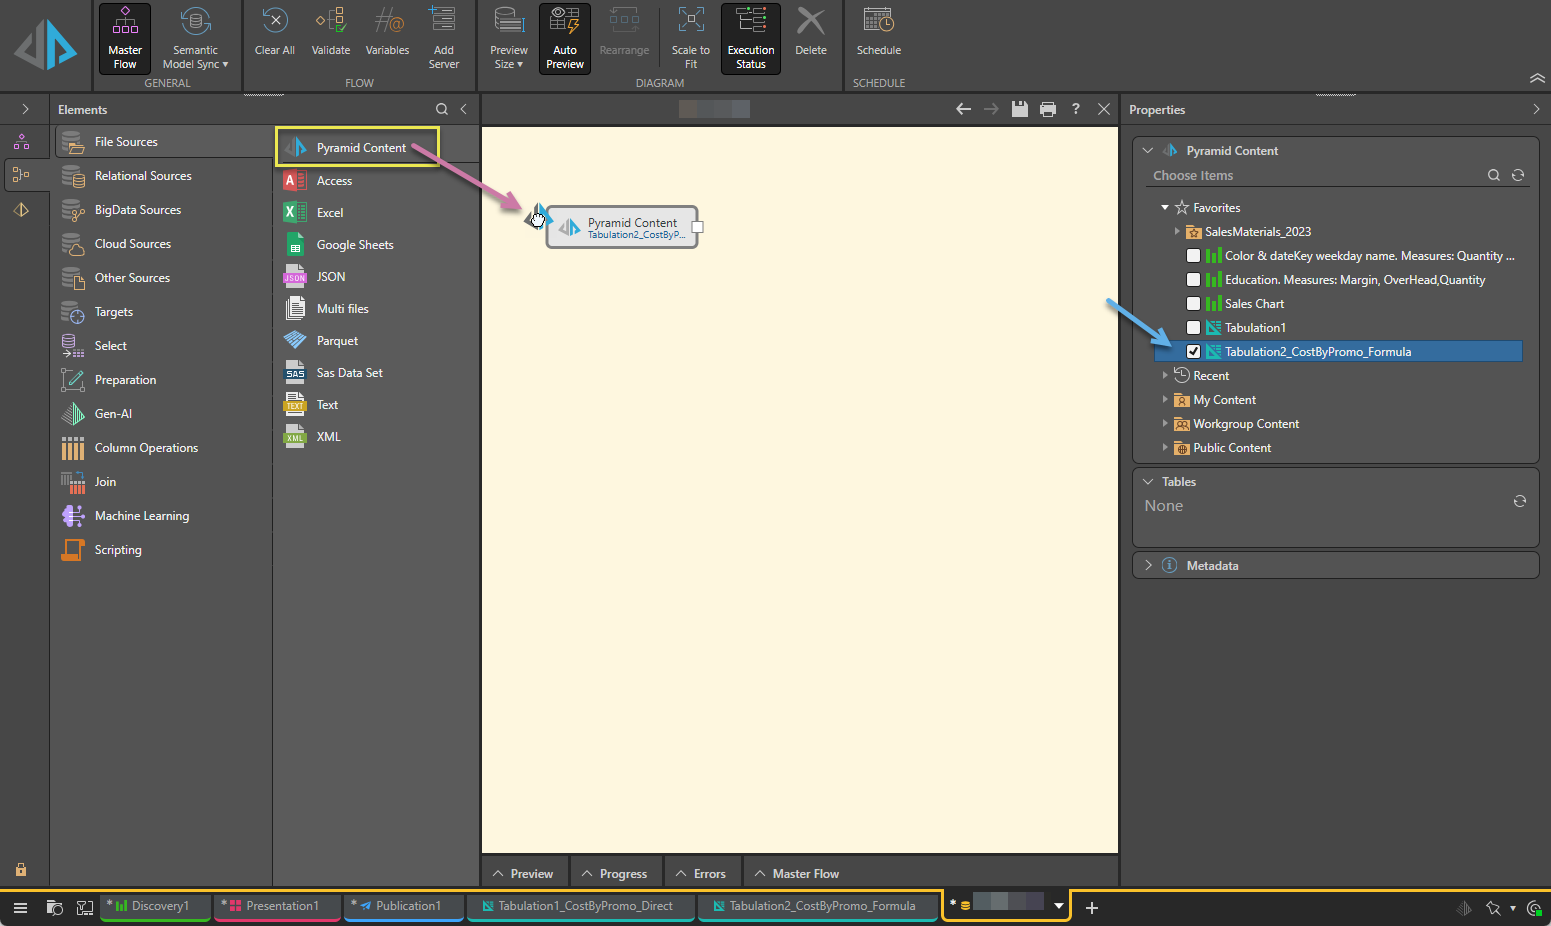
The Properties panel opens to the right.
Your tabulations and discoveries can be in any folder that you have access to. You can select multiple reports from different folders and domains as needed.
Once you have selected the tabulations that you want to use as your source, the Tables panel is updated with the names of the visual areas in those files.
Step 2: Create your Tables
With your tabulations selected in the Choose items panel, the Tables panel lists the visual areas in those files:
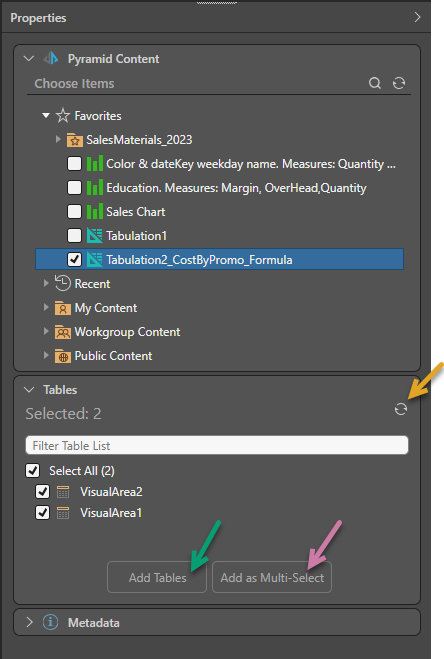
Tip: If your visual area is not present in the list (for example, because your tabulation doesn't have any visual areas), you can right-click the tabulation in the top panel, select Open in Tabulate, and then make the necessary changes to your file. If you make any changes after selecting the tabulation, you will need to save the tabulation and refresh the Tables panel (orange arrow above) to pick up your changes.
To create your tables, select the relevant visual areas in the Tables panel and:
- If you want to generate an individual Table node for each table, click Add Tables (green arrow).
- If you want to generate a single Tables node for all selected tables, click Add as Multi-Select (purple arrow).
Note: If you create a single Tables node, you can only connect it to a Target node. This means you will not be able to perform data cleansing and manipulations by connecting to preparation nodes and so on.
What next?
Once you have created your data source and tables, you should check the preview to make sure your table has the columns that you expected. To do this, select the Table node on your canvas and click Preview. The Preview panel opens at the bottom of the page.
You should add more nodes to your Data Flow:
- Add other nodes to prepare and manipulate the data - This includes preparation (applying formulas to the data), transforming your data automatically using an LLM (Gen-AI) or Machine Learning, manipulating the content of your tables (performing column operations and joining tables), or using R or Python scripts.
- Add a Target - Set up the target destination to store the processed data.
Tip: You may need to unpivot the data in your tables. This will typically be the case where your tabulation has a direct connection to a discovery with complex content. For more information, see Unpivot.