Use Shapify in Pyramid to represent the data points on your chart with shapes. When you shapify values, you copy your values to the Shape drop zone and cause the values to be represented with different shapes.
The Shape drop zone and the Shapify option in the Values drop zone are enabled when working with charts that display Data Points. Charts that can display data points include Line, Point, Lollipop, Area, Stream, Plotted, and Radar charts.
Shapifying Measures
The Shapify function in the Value drop zone's context menu allows you to use Measures to drive the shape of your data points.
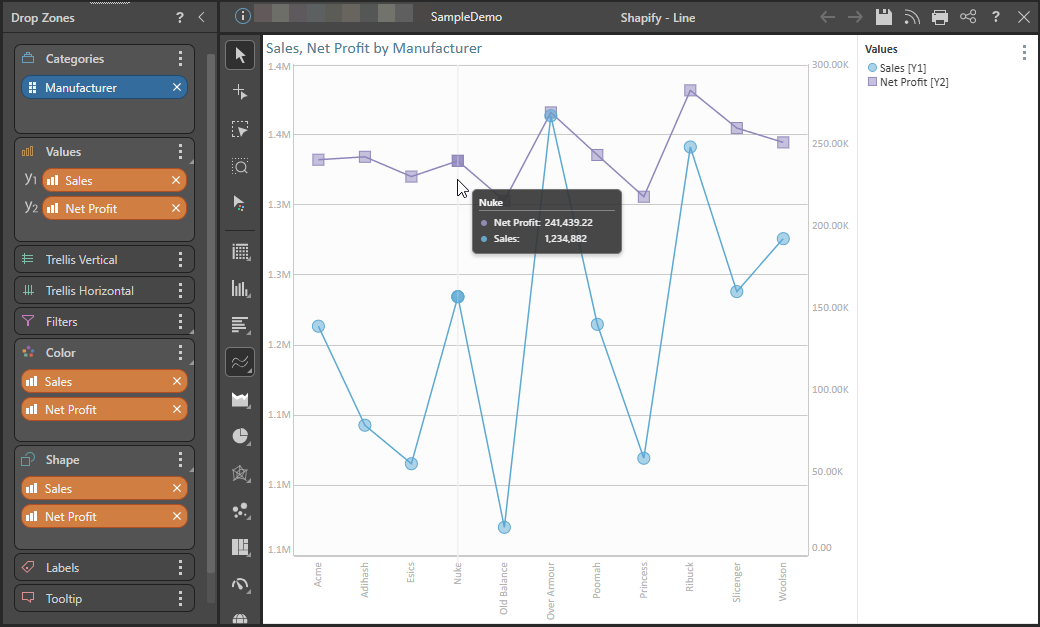
For example, this functionality allows you to render data points for Sales measures as circles and Net Profit as squares:
Step 1: Build Your Initial Chart
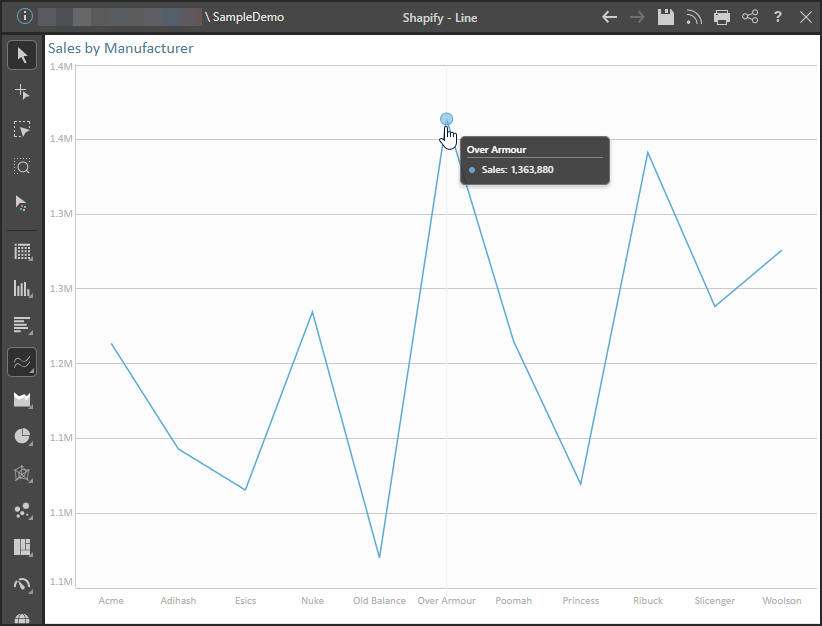
- Start by adding a single hierarchy and a single measure to a line chart. In this example, the Manufacturer hierarchy and the Sales measure:
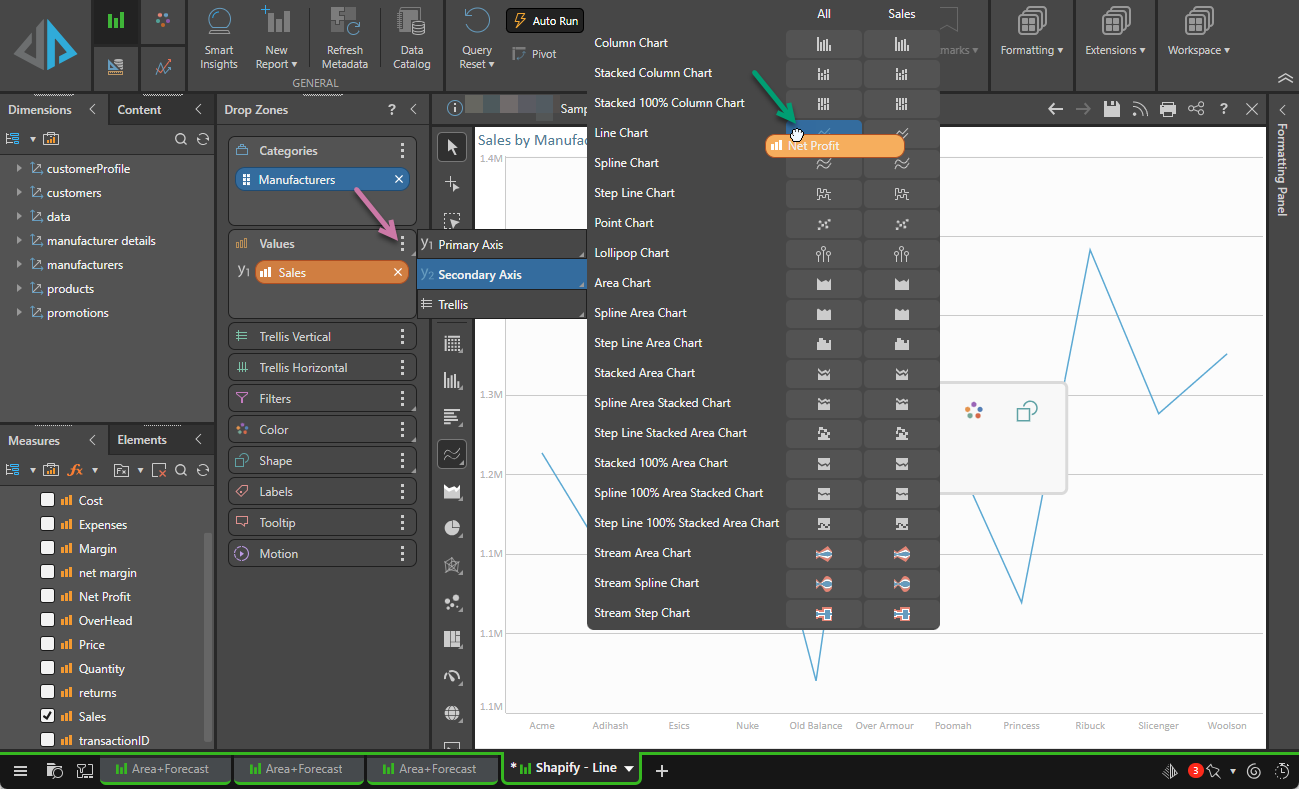
- Add your second measure to the secondary axis. In this example, drag the second measure (Net Profit) onto the Values context menu (purple arrow) and drop it onto the Secondary Axis submenu at the Line Chart / All intersection (green arrow below):
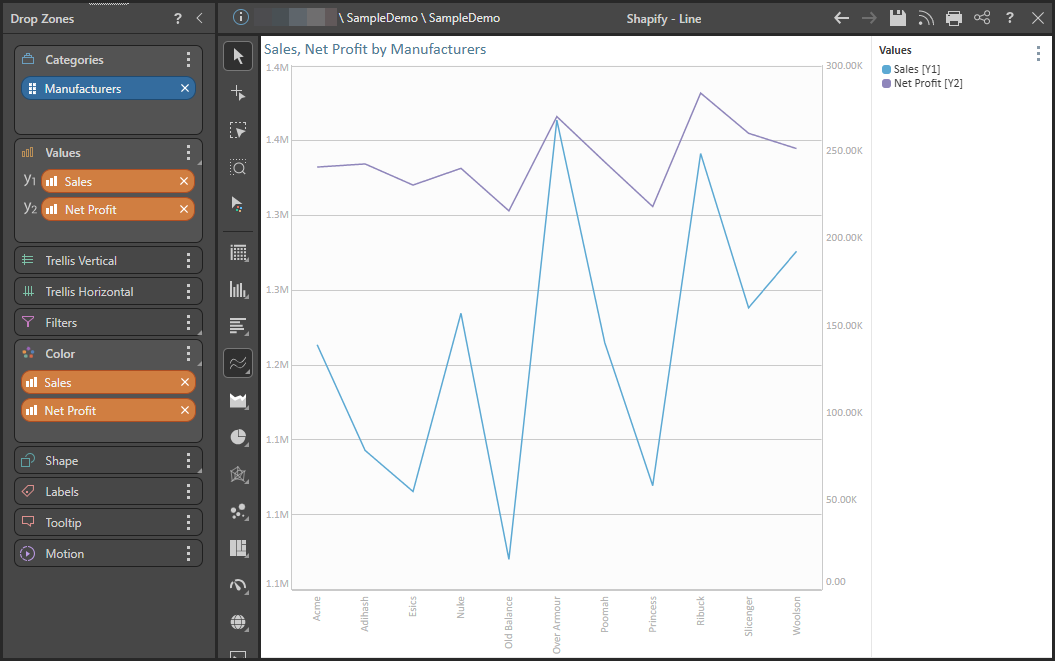
This results in your measures being added to the same chart and automatically colorized:
Step 2: Shapify your measures
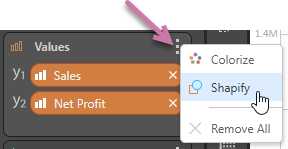
- Open the Values context menu (purple arrow below) and click Shapify:
- If you want to show the data points on your visual, you must either enable Data Points in the Component Ribbon or enable Shapes in the Formatting panel.
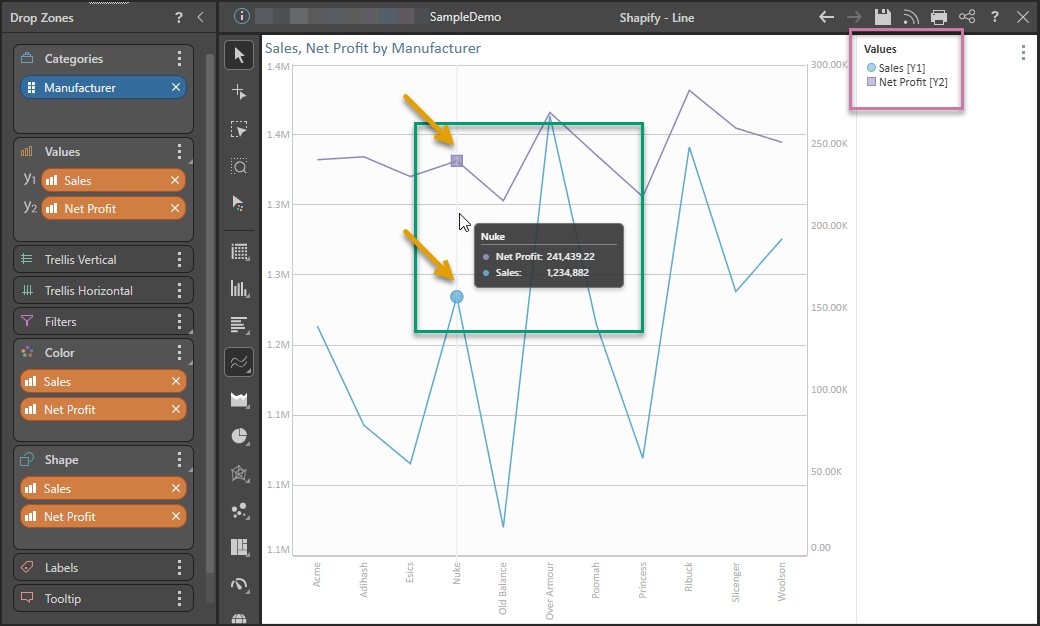
Your measures are copied into the Shape drop zone and a combined color shape legend is produced automatically (purple highlight below). Hover your cursor to view the data points as shapes on the visual:

Adding More Measures
You can continue adding measures as required. Remember that you must complete both step 1 and step 2 if you want to add your measure and shapify it.
Related information
Format your Shapes and Legend
Your data points are now "shapified." You might want to use the Shape and Legend options in the Formatting panel to optimize their appearance:
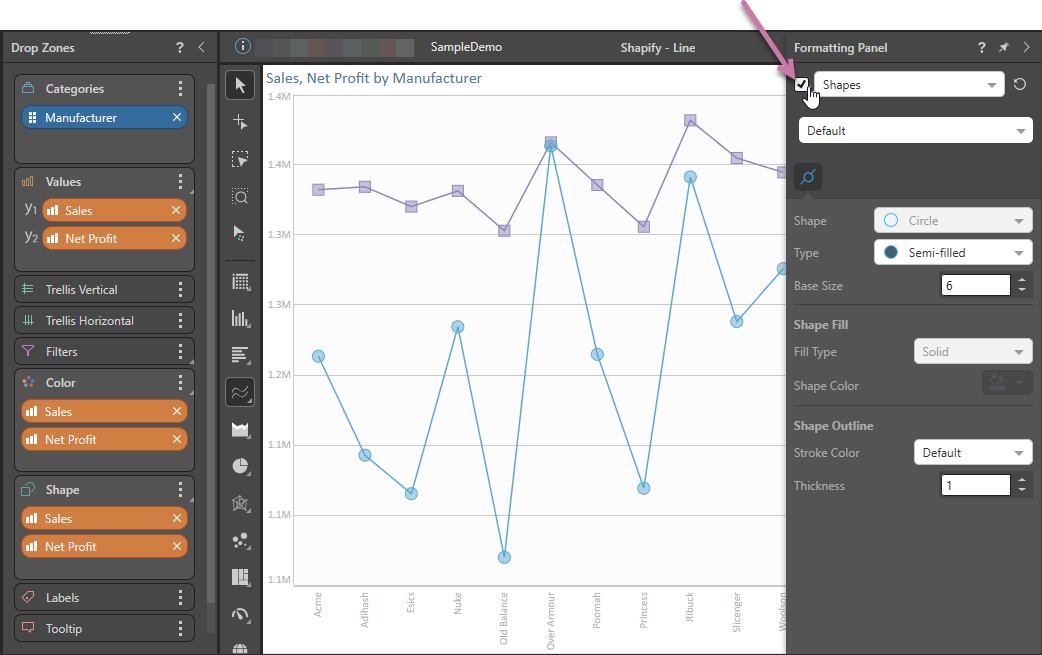
- To format your shapes, open the Formatting Panel and select Shapes (purple arrow below). You can use the Shape, Type, Size, and other options in this panel to adjust the appearance of your Shapes. For details of these options, see Shapes and Data Point Formatting.
- To format the Legend, open the Formatting Panel and select Legend from the dropdown list (purple arrow below). You can use the Legend options to adjust the position and appearance of your Legend. For details of these options, see Legend Formatting.
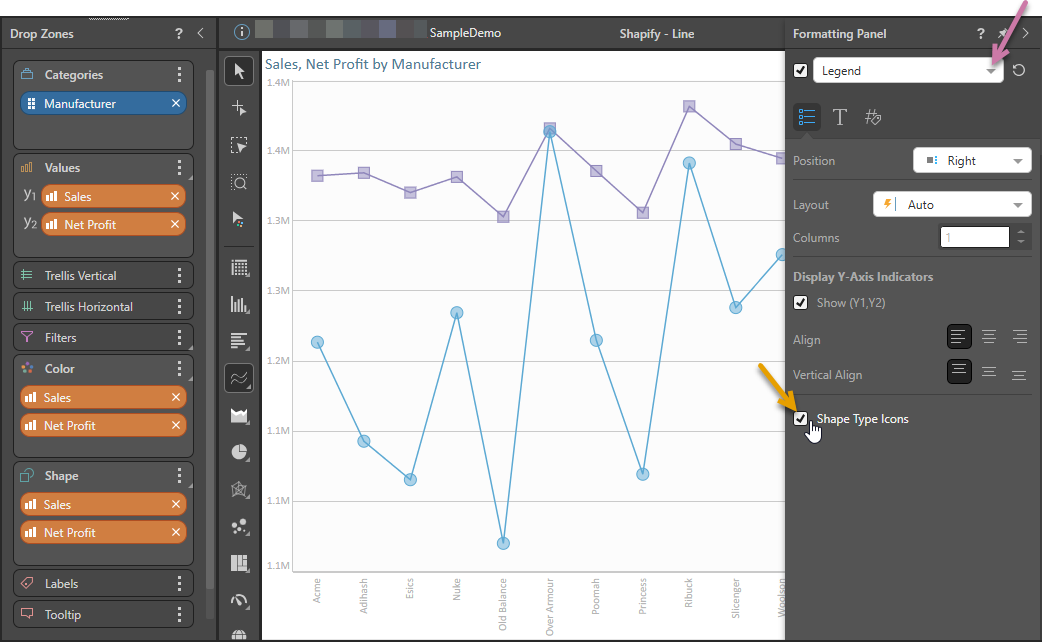
Tip: Select the Shape Type Icons checkbox to make the icons in the legend match the Type (Fill, Semi-filled, Empty) used for the Shape. For example, if this checkbox is selected and Fill is selected from the Shape's Type dropdown list, both the Shape and its Legend item are Filled.