When you Include Visualizations in your Smart Insights, you prompt the AI to automatically generate relevant visuals and add them inline. The visuals complement the insight content, visualizing forecasts, trends, outliers, and so on, and (on Expand) offering interactivity to explore the data therein.
Adding Visuals to your Smart Insights
Before you begin
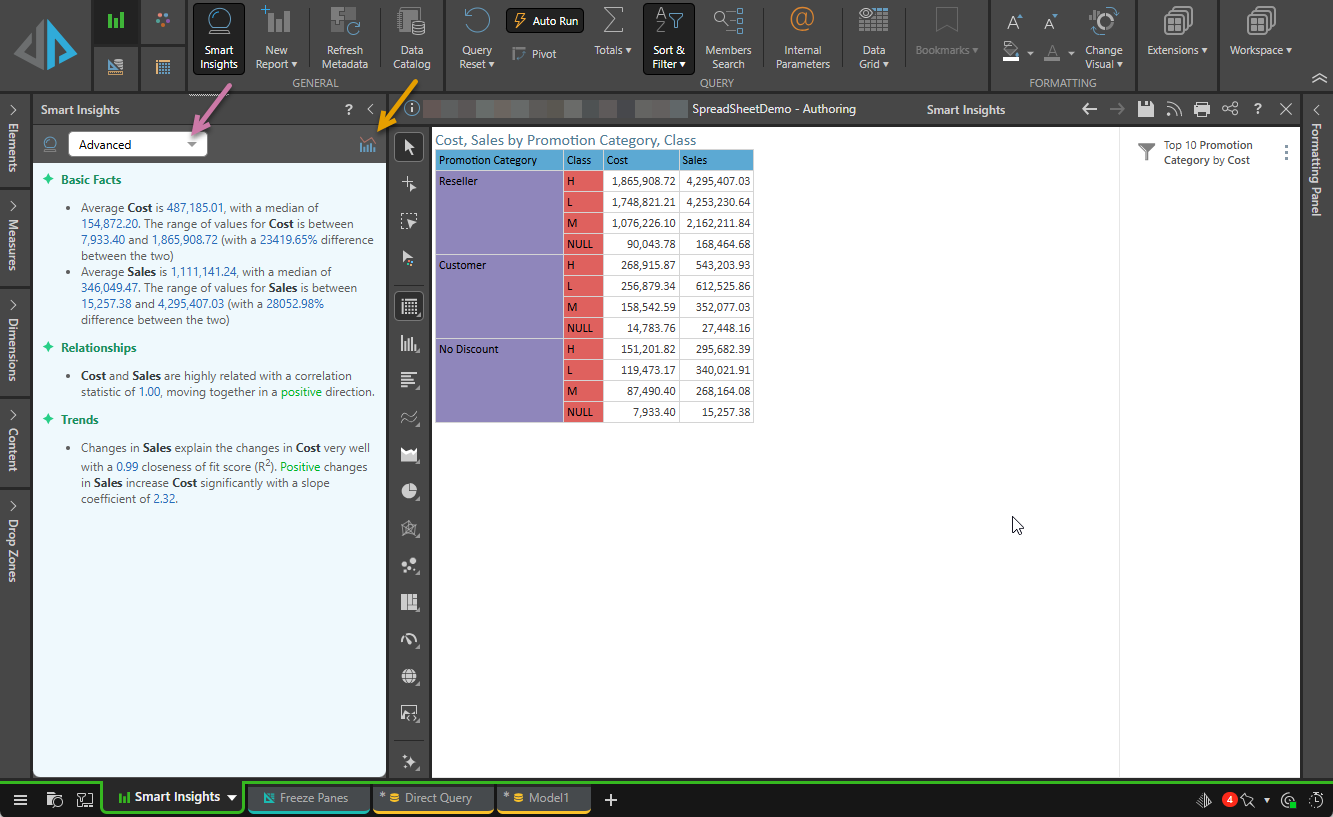
- You must have already opened Smart Insights and selected the level of detail you want your insights to take (purple arrow below). For more information, see Smart Insights in Discover Pro.
Generating Visuals
With the Smart Insights panel open:
- Click Include Visualizations in the panel header (orange arrow below).
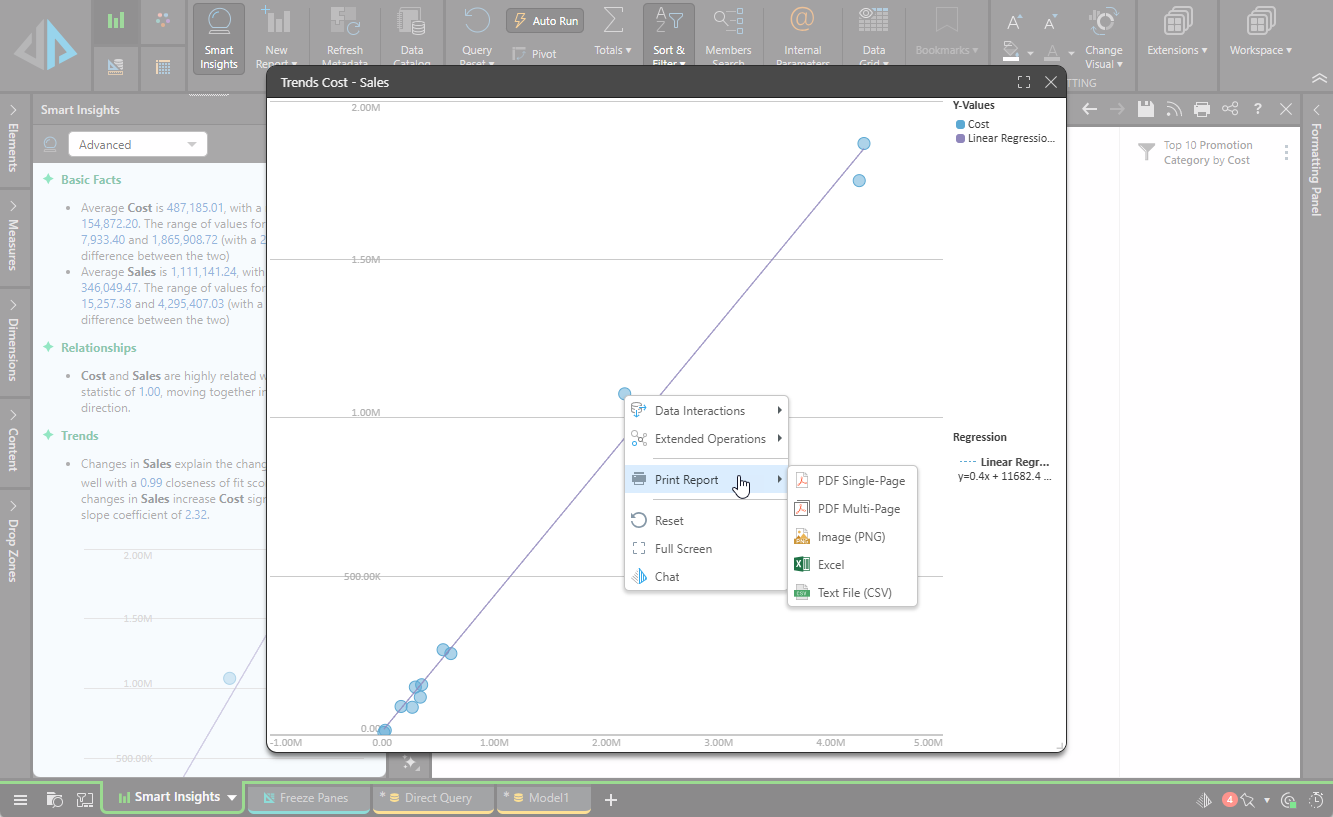
- Click Expand (blue arrow above) to open the visual in a pop-up dialog:
- Interact with the visual using the standard functions:
- Hover your cursor over data points to view data on the tooltip.
- Select data points, legend items, and so on to focus on them.
- Right-click data points, the chart background, and so on to access the context menus and view details, sort and filter the visual, print the report, change the visualization type, run the Chatbot, reset any changes you previously made, and so on.
- Close the pop-up from the top-right.
Visuals are generated and displayed as part of the analysis. In this case, a scatter plot is created and added to the Trends section (purple highlight below):

Important: These visuals are generated on the fly using AI and will be regenerated whenever you close and reopen the panel, or whenever the underlying query changes. Because neither the Smart Insight nor its visual is stored, all generated content may look slightly different each time it's recreated.
The available context menu functionality is a subset of the functionality available to the users of the Embedded experience. For more information, see Embedding.
The pop-up closes. Any changes you made when exploring the visual are lost.