Smart Insights use AI to analyze your query and return a natural language analysis. Depending on your selections, insights may represent a Summary overview of your visual or a Light, Advanced, or Categorical analysis. In Discover, you can also show visuals that illustrate the trends, forecasts, and so on that your analysis returns and explore those visuals in a pop-up.
Smart Insights work directly on any supported data source.
Important: Smart insights can be used in Discover and Present. The content is updated whenever the Smart Insights panel is opened in Discover, whenever the contents of the visual are changed, and whenever the presentation is refreshed at runtime. Alternatively, you can add similar Text Field insights in Publish and Present. For more information, see Generated Insights.
Smart Insights
The insights are generated in the current user's chosen application language. This includes support for right-to-left text in Hebrew or Arabic.
Note: This feature is not available in the Community Edition.
Opening the Smart Insights Panel
To open the Smart Insights panel in Discover:
- From the Report ribbon, click Smart Insights (purple arrow below).
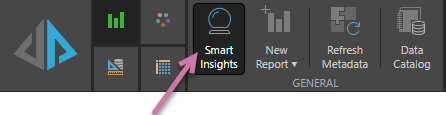
The Smart Insights panel opens alongside your visual.
Tip: You can also use the Chatbot to "get insights." This returns smart insights about your visual. For more information, see Natural Language Interfaces.
The Smart Insights panel shows the results of the impact analysis performed on the current visual:
Note: Smart Insights are dynamic, updating in real time. Any change to your query, such as adding a filter, causes the insight panel to be updated instantly.
Interacting with the Smart Insight
Level of Detail for Smart Insights
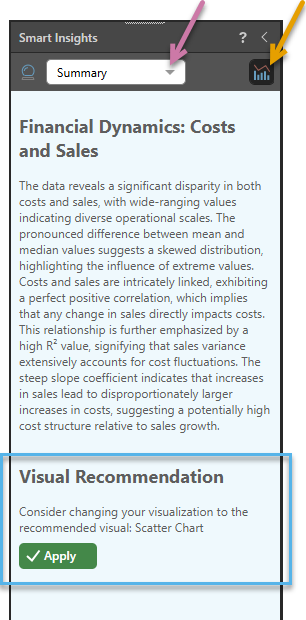
From the Smart Insight dropdown list (purple arrow above) select the level of detail you would like to see in your insights:
- Select Light, Advanced, or Categorical to view an analysis with different levels of detail, from basic stats to correlations, trends, outliers, forecasts, and so on.
- Select Summary to view an LLM-generated summary of the visual's content.
For more information, see About Smart Insight Content (below).
Include Visualizations
![]() Click Include Visualizations from the header (orange arrow above) to incorporate visuals into your Smart Insights. When you Include Visualizations in your Smart Insights, you prompt the AI to automatically generate relevant visuals and add them inline. The visuals complement the insight content, visualizing forecasts, trends, outliers, and so on, and (on Expand) offering interactivity to explore the data therein.
Click Include Visualizations from the header (orange arrow above) to incorporate visuals into your Smart Insights. When you Include Visualizations in your Smart Insights, you prompt the AI to automatically generate relevant visuals and add them inline. The visuals complement the insight content, visualizing forecasts, trends, outliers, and so on, and (on Expand) offering interactivity to explore the data therein.
About Smart Insights Content
Smart Insight options
Light analysis
Light analysis offers simplified metric analytics, covering measures but not categories. Depending on the amount of data in the query, Light insights may display the following information:
- Basic Facts: Standard metric analysis, including the average, maximum, minimum, and dispersion.
- Pareto Analysis: The value's total and top n and bottom n, that account for a certain percentage.
- Relationships: Any positive or negative metric correlations and relationships.
- Trends: Uses regression analysis with r-squared and slope coefficients to explain how changes to a metric affects another metric.
- Forecasts: Best fit forecasting (across eight different algorithms) if the query contains a date-time hierarchy to predict whether a value will increase or decrease over a certain period and by how much.
Advanced analysis
Advanced analysis displays more in-depth metric analytics. Depending on the amount of data in the query, Advanced insights may display the following information:
- Basic Facts: In addition to the basic facts generated by the Light analysis, this also shows the median and standard deviation.
- Pareto Analysis: Same as the Light analysis.
- Relationships: Same as the Light analysis, with the addition of a correlation statistic.
- Trends: Same as the Light analysis, with the addition of displaying the closeness of fit score and the slope correlation.
- Forecasts: Same as the Light analysis, but it also stipulates which forecasting algorithm was used, and the range of fluctuation.
- Outliers: The multi-variate outlier analysis displays the top three most outstanding data points in the query. It also shows the probability density for each outlier.
Categorical analysis
Categorical analysis shows simplified category / element analytics. Depending on the amount of data in the query, Categorical insights may display the following information:
- Comparatives: Compares the metrics for each category with the category that has the highest value for the same metric.
- Correlations: Displays any positive or negative correlations between measures for each element where a correlation exists.
- Forecasts: Best fit forecasting if the query contains a date-time hierarchy, predicting for each category whether the value will increase or decrease over a certain period and by how much.
- Outliers: A light version of the Advanced analysis.
Summary
The Summary summarizes the visual at a high level. What is in the Summary depends on the LLM used and the content of the visual itself. You can regenerate a new Summary by changing the selection from your dropdown list to any other option and then returning to Summary.
Visual Recommendation
If you have not selected the most suitable visualization type for your data, Discover will offer a Visual Recommendation panel at the bottom of the Smart Insights Summary (blue highlight above). Clicking Apply applies the visualization type that will most effectively communicate the information in your visual.
Note: Pyramid uses the Auto Recommend functionality to automatically select the most suitable visualization type for your data. For more information, see Auto Recommend in Discover Pro.
Fairness analysis
If you are using an LLM to generate Pyramid content, and your administrator has enabled Fairness Analysis in your AI settings, then some fairness analysis content will be generated by the LLM and added to the content in your Smart Insights panel or any Slide or Page Insights added to your presentation or publication, respectively.
The fairness content, generated by the underlying LLM, is created through an analysis of the measures and attributes used in the discovery (but not the values of those measures and attributes) and provides insights into any bias that may disproportionally harm or benefit any group, particularly historically disadvantaged groups.