Key Performance Indicators (KPIs) are powerful analytic tools that can be leveraged to identify the status of outcomes in an organization's business goals. KPIs can be configured in the Formulate module using the KPI wizard, by defining an actual value (the value to be measured), a target value (your goal), and a status value (the calculation that defines how the actual value should be measured against the target value). The KPI can then be added to queries in Discover (see Using KPIs for details). KPI's can also be created using the "Quick KPI" wizard directly in Discover (see below).
All KPIs (including the quick KPIs) are edited in the Formulate KPI tools. When deployed, their settings can be tweaked in Discover through the Conditional Formatting dialog.
Quick KPIs
Users can also create quick KPIs from within Discover, without building a KPI formula in Formulate, through 2 main techniques:
- Basic KPI assembly through conditional formatting by simply adding measures to the Indicator and Color drop zones.
- The Quick KPI function that not only builds the color and indicator logic, but also applies some more sophisticated mathematics with time options.
KPI's as Conditional Formatting
KPI's are, in effect, an advanced form of conditional formatting - adding and adjusting both an icon and color based on values to highlight information in the visual beyond its own visible values. As such, KPI functionality can be built manually with the conditional formatting capabilities in Discover directly. However, these lack the sophistication of KPI's and are usually viewed as part of a matrix grid or in a specialized form known as gauges.
KPI Anatomy
KPIs are composite calculations that drive the way a data point is visualized (either in a grid or gauge typically) - that be used to show the status of metric outcomes using up to 3 core metric values and banding:
- actual - a value that shows what is currently measured
- target - a value that measures what the goal metric should be
- status - a mathematical comparison between actual and target values (normally a ratio of some type)
- banding - a series of values to delineate between good and band status metrics (which can then be used graphically)
Using all 4 layers, designers can construct graphic representations of how the core metric (typically the "actual" value) is performing in contrast to the other figures. Importantly, each metric in the framework (including the bands) can be structured independently, with its own logic, inputs and even parameters. This goes a long way to resolving the problem of building KPIs, which typically need different data selections from a data model to operate efficiently. The use of these elements drive the visualization and are in effect advanced settings for conditional formatting.
Accessing the KPI Designer
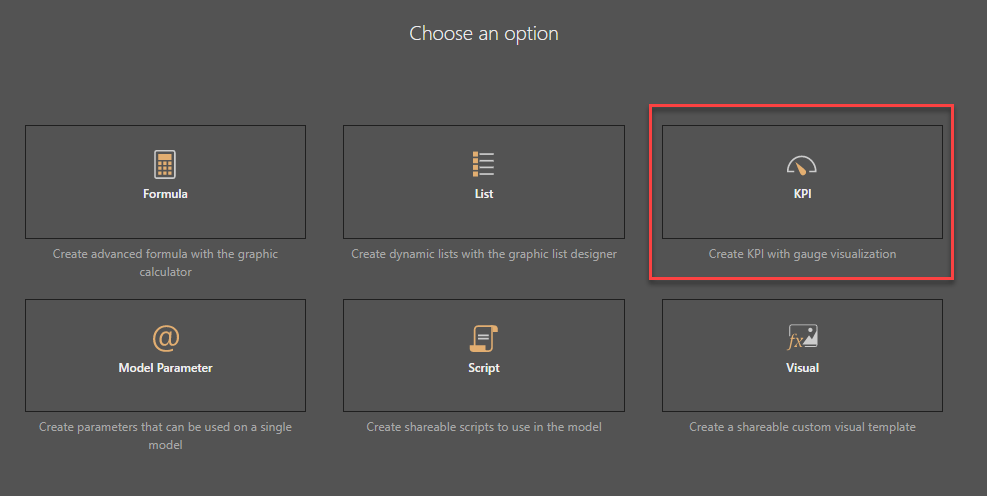
To launch the formal KPI designer, open the Formulate module and select the KPI component:
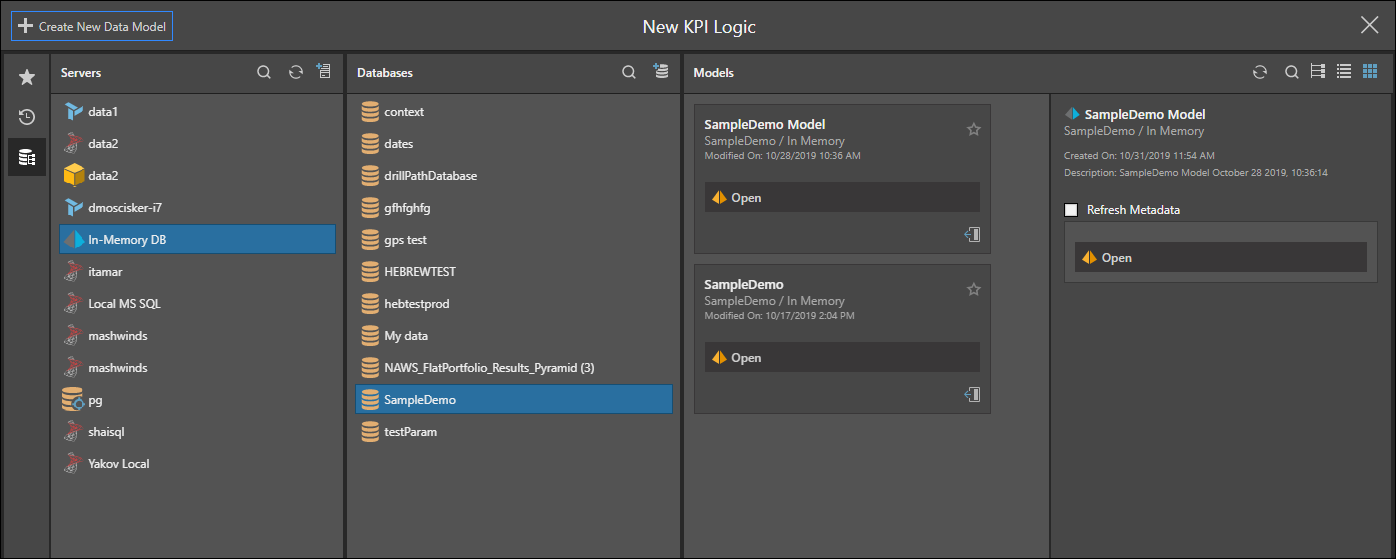
Choose the server, database, and model where you want to build your custom KPI:
Building a KPI
The KPI designer is comprised on five main steps, where users configure the KPI style, the actual value, target value, status value, and the dynamic bands.
The core elements of the KPI use the same logic as custom members. This should be reviewed first before reading further below.
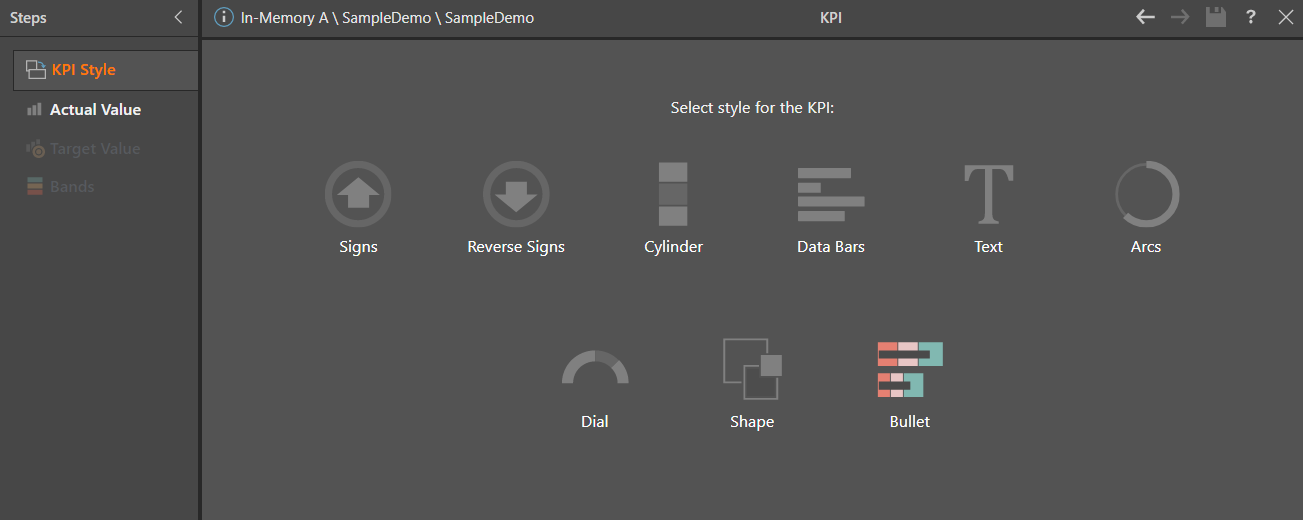
KPI Style
Start here by selecting the required KPI indicator style. When the KPI is visualized in Discover, the chosen KPI style will be used in the visual as the status indicator. These indicators can be used to visualize the KPI status in both matrix grids and gauges.
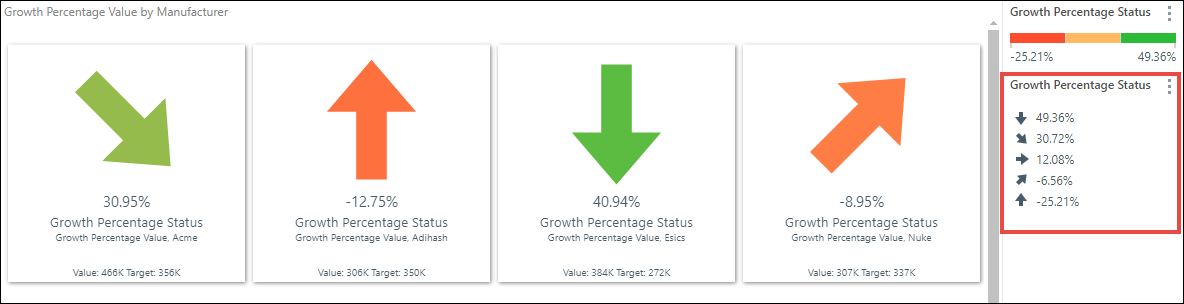
In the example below, the Reverse Signs style was selected and then added to a gauge visual.
Dials and Bullets
The dial and bullet styles behave differently than the other KPI styles. The rest of the styles can be used as a status indicator in both matrix grid and gauge visualizations. Dials, however, are designed specifically for use in the gauge visual; if a dial indicator is added to a grid, the text indicator will be rendered instead of the dial.
Likewise, the 'bullet' style is designed for use with the bullet chart. While it does not produce a status indicator, it updates the drop zones to remove the indicator zone, which is not required for the bullet chart.
Actual Value
The value representing the level of ACTUAL performance. Using the tool panel, add the required blocks and functions in order to write the actual value expression. Element, Aggregation, and Date blocks (red highlight below) must be injected with the required model metadata from the properties panel (blue highlight).
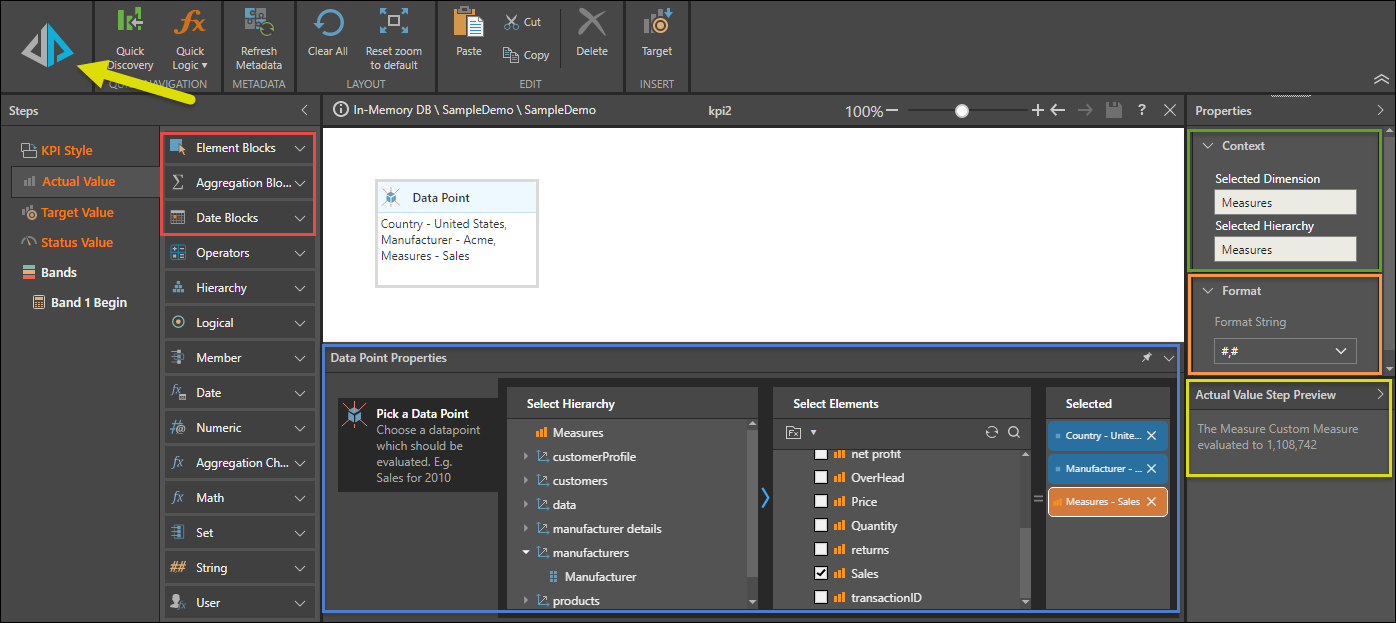
Context Panel
The context panel (green highlight above) displays the location where the KPI will be saved. Each KPI must have a designated parent dimension and hierarchy (in the Properties panel). Building a KPI creates custom measures, and as such, they are automatically saved in the measures dimension and hierarchy.
Format Panel
The value's format string may be changed from the Format panel (orange highlight). Users can apply a format string to each custom measure within the KPI, in order to determine how metrics for the custom measure are formatted. Format string options include a variety of presets, like currency, percentage, and standard number masks like "#,#".
Step Preview Panel
Users can test KPIs at any step in the KPI builder, by clicking the execute button (yellow arrow). The Step Preview panel (yellow highlight) will display a preview of the results for that step.
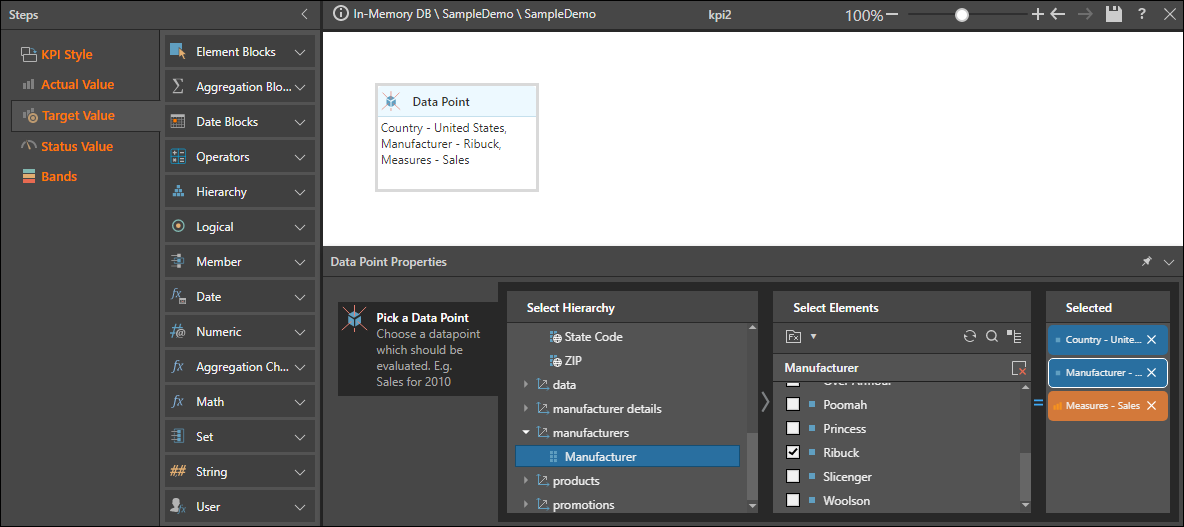
Target Value
The intended GOAL or TARGET of performance the actual is to be measured against. Use the tool-panel to create the target value.
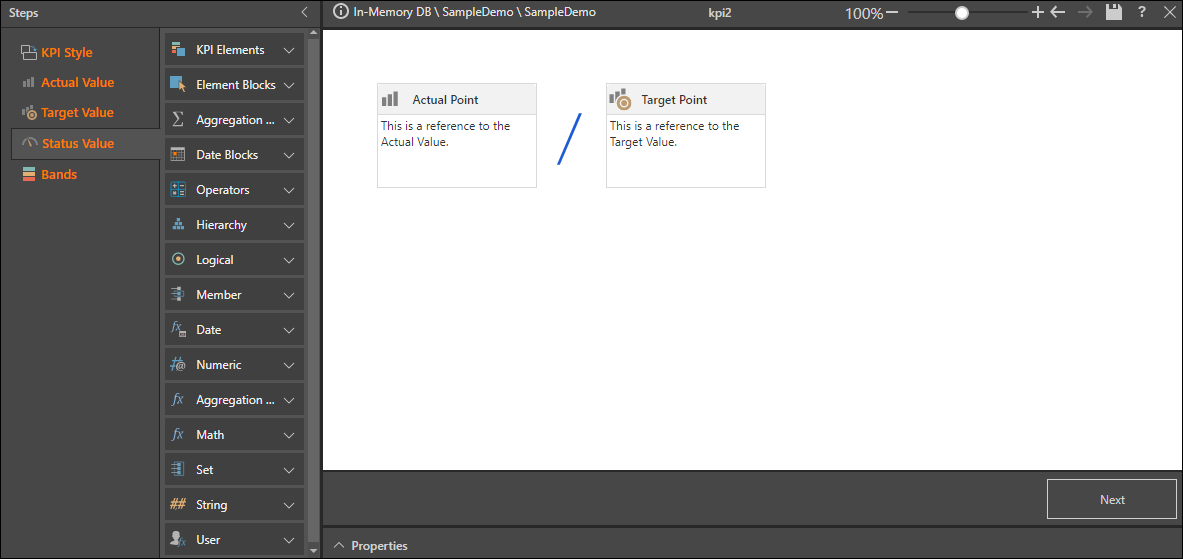
Status Value
The logic for the KPI's status calculations and the graphical representation of the KPI. “Status” is how the actual compares to the target. Use the tool-panel to write the status value formulation, or choose a formula from the Templates drop down in the ribbon. The formula that you configure is used to generate the status value.
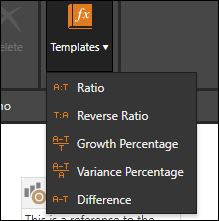
Template Formulas
There are five formulas available from the Templates drop down:
- Ratio: Actual/ Target
- Reverse Ratio: Target/ Actual
- Growth Percentage: Actual - Target / Target
- Variance Percentage: Actual - Target / Actual
- Difference: Actual - Target
Bands
Define the ranges (bands) for the KPI. Start by enabling bands:
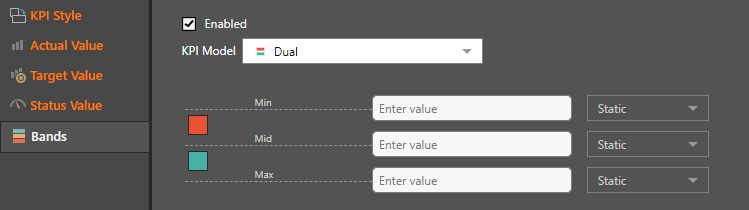
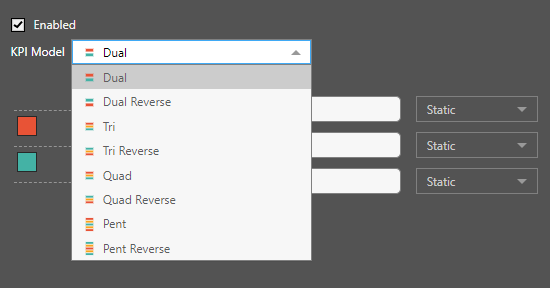
Next, choose the KPI model; the model selected determines the number of bands. The following options are available:
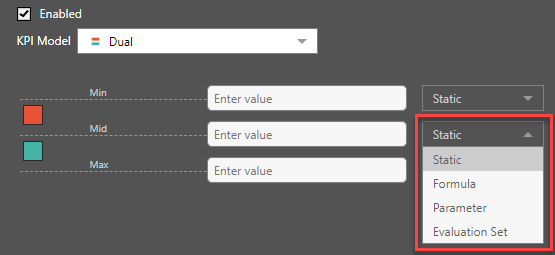
Next, insert static or dynamic values into each band; the band ranges affect the KPI color display. You may select a static value, a formula, parameter, or evaluation set. Using the more advanced band options allows for dynamic banding for KPI values - which produces a more efficient and more intelligent solution.
- Click here for more information about KPI dynamic banding.
Band Colors
Band colors are NOT defined in the KPI designer tools. Instead they are derived by default from the prevailing theme used in the report or dashboard. Alternatively, users can edit the colors of the bands using the Conditional Formatting dialog box.