Discover Pro features a highly customizable workspace, along with a number of panels that are central to the query-building process. Review this section to learn how to navigate the various ribbons, workspaces, and panels that are essential to authoring content in Discover Pro.
Note: Whether you see the Discover Pro or Discover Lite workspace depends on your access to the system. If you see a less complex view than the example below (specifically if the overhead ribbon is much simpler), see Discover Lite Workspace.
Workspace Structure
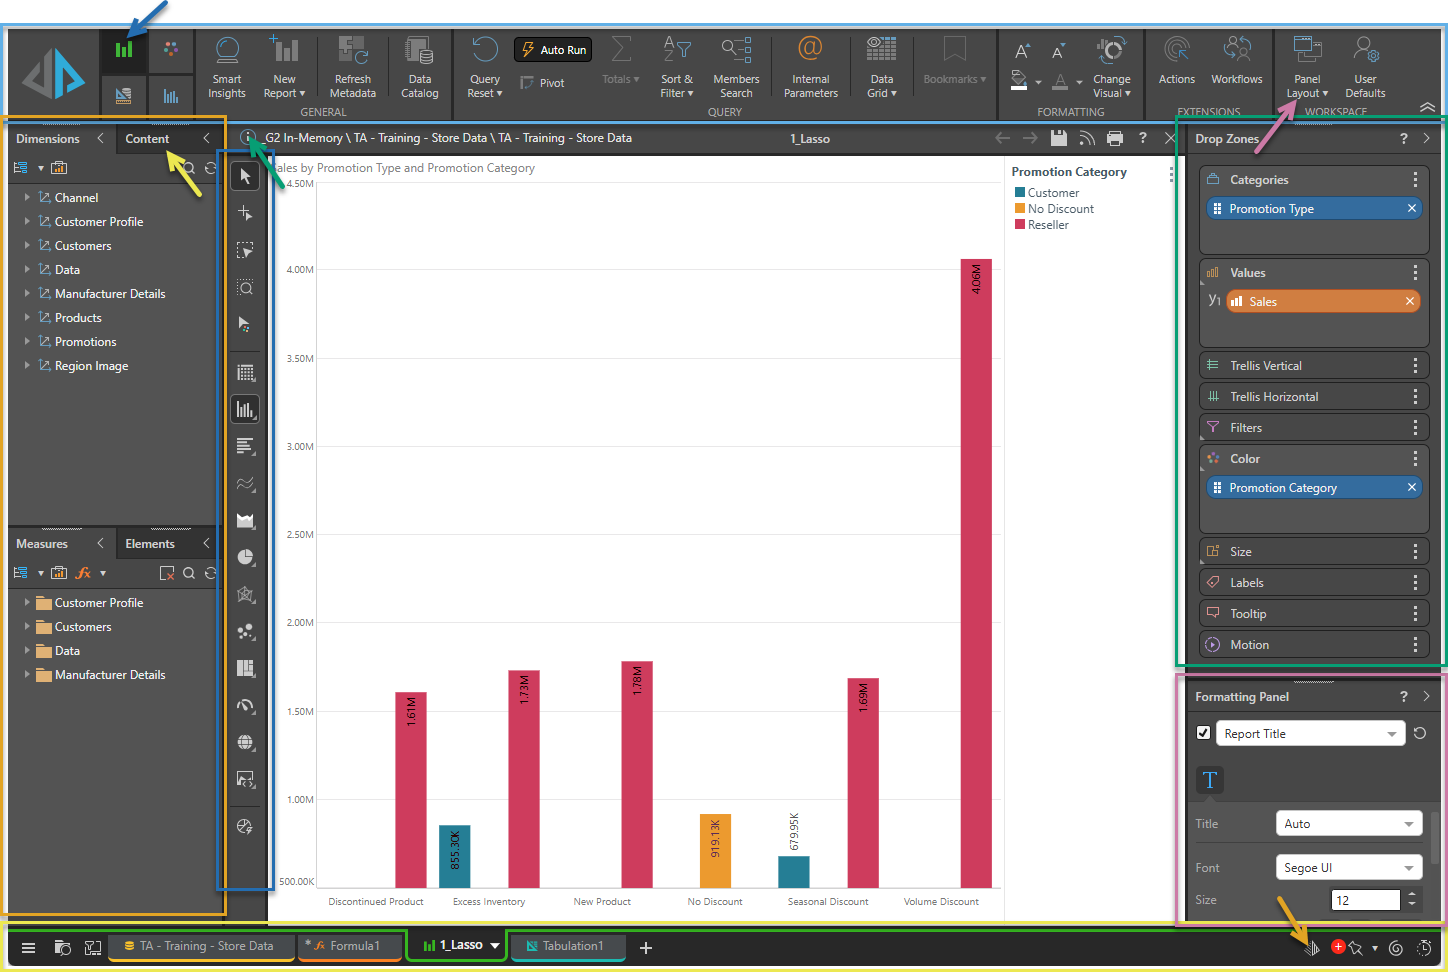
Tip: Discover Pro users can change the layout of their workspace by selecting one of the workspace "preset" options (purple arrow above), and by making use of panel modularity throughout the app to drag, drop, dock, and show or hide the panels. For more information, see Panel Layout.
Ribbons
Discover Pro features four overhead ribbons (pale blue box above), which you can switch between using the tabs to the left (dark blue arrow):
- Report Ribbon: Also called the Home or Discover ribbon. This is the main ribbon and offers quick access to a range of commonly used tools, including a handful of query and formatting functions.
- Design Ribbon: Includes functionality that enables the user to customize the report design.
- Component Ribbon: Offers formatting choices that affect the look and feel of the current visual.
- Query Ribbon: Offers a range of tools aimed at customizing the query itself.
- Click here to learn about the Discover Pro ribbons.
Data Model Trees
The Dimensions, Measures, and Elements Trees (orange box) allow you to access the tables, columns, and measures in your data model. You can browse these trees to locate the required items and drag them into the drop zones to build your query.
Dimensions
The Dimensions Tree includes the data model's dimensions, which are equivalent to the tables in the data source. Each dimension can be expanded, revealing the hierarchies contained within it. The required hierarchies are then added to the drop zones.
Elements
The Elements Tree is comprised of the elements (equivalent to a column's rows in the data source) within a given hierarchy. The user can open a hierarchy's elements tree and add only specified elements to the query, rather than adding the entire hierarchy.
Measures
The Measures Tree contains the model measures, divided into sub-folders. The user locates the required measure within its folder and then adds it to the drop zones.
Drop Zones
The Drop Zones panel (purple box above) is where you "drop" the dimensions, measures, and elements from your trees to build your queries. As you drag your items into the drop zones they affect the data that is returned, as well as the visual elements of the query. For example, a visual's color can be driven by a specified measure simply by dragging a measure from the Measures tree into the Color drop zone.
Content panel
The Content Panel (yellow arrow above) shows a tree of existing discoveries which can be opened on a new Discover tab.
Metadata panel
The metadata panel displays metadata information about the visual. This includes the measures and attributes it contains, any filters that are applied to it (where applicable), its statistics (the number of columns, rows, and cells it contains), its actual metadata (name, stored location, and time stamps), and the item ID that is used to uniquely identify it in Pyramid.
- Hover your cursor over the Info icon at the top-left of any visual to open a pop-up showing a summary of the visual's details.
- Click here for more information about the Metadata Pop-up
Toolbox
The Toolbox, on the left-hand side of the canvas (dark blue box), provides access to the key buttons you need when building your discovery. Most of the Toolbox buttons let you change your visualization type either to one of the out-of-the-box types or to a custom type. There are also some selector tools that allow you to select the content items in your discovery to interact with them.
- Click here for more information about the Toolbox
Formatting panel
You can use the options in the Formatting panel (green box) to set formatting preferences for visuals, legends, slicers, and so on. Select the item on the canvas to change its formatting.
- Click here for more information about the Formatting panel
App Tabs
The App Tabs along the bottom of your page (yellow box) allow you to move between your currently open discoveries, presentations, and so on. You can also create a new files, access App Tab menu options relating to a specific tab, and, if enabled, open the Chatbot (orange arrow) and other tools including the Performance Dialog, Bulletin Board, and Job Spooler.
- Click here for more information about the App Tabs
Smart Insights panel
The Smart Insights panel can also be opened in a panel in the Discover app, but is not shown in our example. Smart Insights use AI to analyze your query and return a natural language analysis. Depending on your selections, insights may represent a Summary overview of your visual or a Light, Advanced, or Categorical analysis. In Discover, you can also show visuals that illustrate the trends, forecasts, and so on that your analysis returns and explore those visuals in a pop-up.