The Summarize node is used to construct a new summary table. The new table groups and aggregates the data in specific columns.
In the example below, the customerProfile Table is connected to the Summarize note and:
- The Education column is added to the Summarize node and the Group By function is applied.
- Then the Income column is added, and the Average function is applied.
The resulting table displays the five education groups and the average income for each group.
Configuring a Summarize node
Connect the Summarize node to the Select node representing the relevant table.
Step 1: Set up your Summarize node
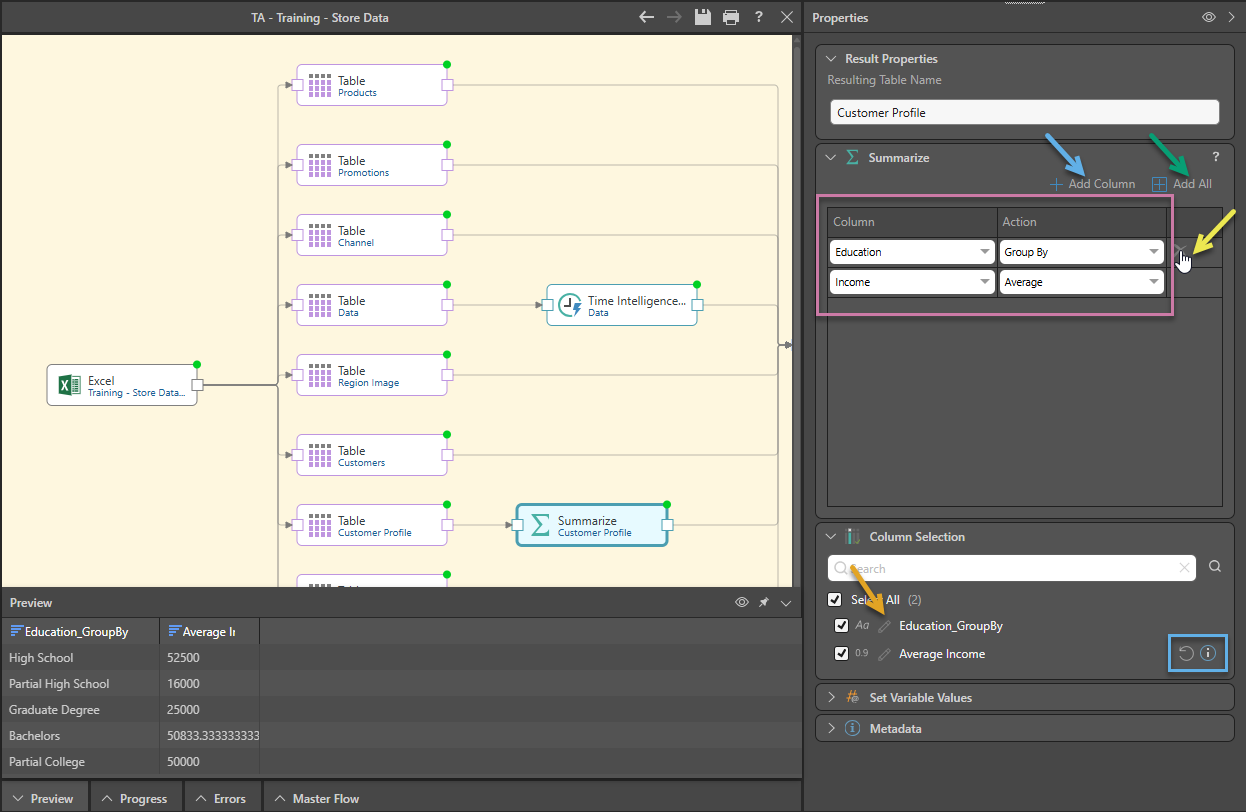
With the Summarize node selected, go to the Properties panel to set up the Summarize properties:
- To add the columns to be summarized, do one of the following:
- Click Add Column (blue arrow above) to add a single column. Repeat as required.
- Click Add All (green arrow) to add all of the columns from the table in one move.
- Click Add Column (blue arrow above) to add a single column. Repeat as required.
- Map each Column to an Action as required (purple selection).
- Optionally, remove any columns that you don't want to include by hovering over the row and clicking the Delete icon (yellow arrow).
Note: If you added one column at a time, you need to create the mapping for each of your columns. If you added all columns in one action, you only need to change the action where "Group By" is not your required action. For details of the available actions, see Summarize Functions.
Rename your Summarized columns
By default, your summarized column will take the name: <Column Name>_<Action Name>. For example, if you are grouping by Education level, the first Summarized column is called Education_GroupBy.
You can rename your columns by doing one of the following:
- You can add a Rename node to your Data Flow and connect it after the Summarize node.
- You can rename the columns using the Edit option in the Column Selection panel (orange arrow above).
Note: You can see that one of the columns has been updated in the example above, because the Info icon (blue box) is visible. This icon is only shown where a column has been renamed. Hover your cursor over this icon to see the column's original name as a tooltip, and click Reset to return the column to its original name.
Step 2: Join your original table and the Summarized columns
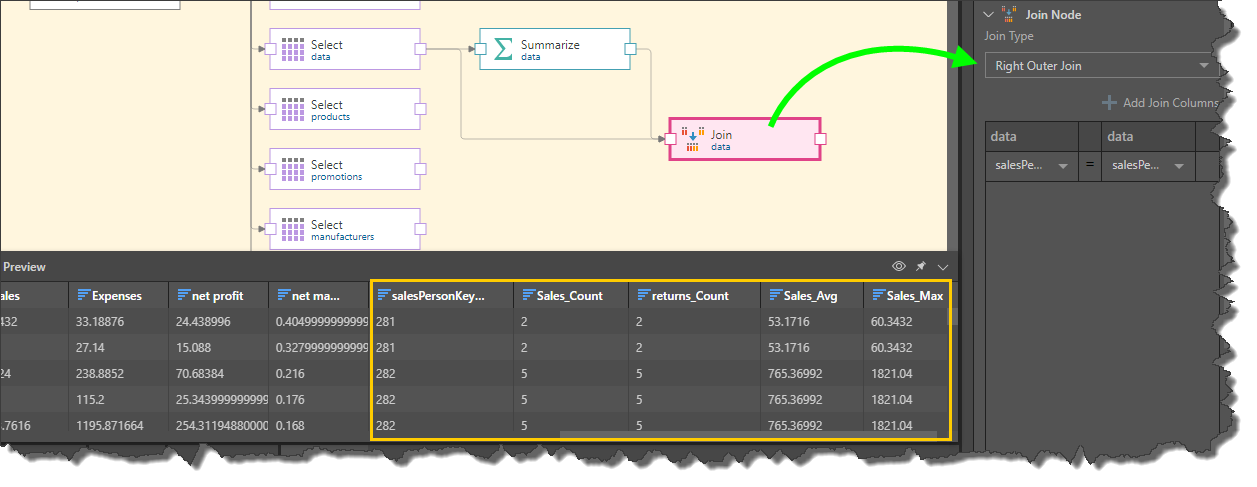
To produce a table consisting of the columns from the original table and the Summarize columns:
- Add a Join node to the canvas and connect it to both the Table node and the Summarize node.
- In the Join node's Properties panel:
- Set Join Type as Right Outer Join.
- Set the Join Columns; both columns must exist in both the original table and in the Summarize table.
- Preview the Join node to see a preview of the table with the Summarize columns.
- Click here to learn more about Joins.
Summarize Functions
The following functions may be used to generate the Summarize columns:
- Group By: Groups the summarized columns by this column.
- Count: Returns the number of rows in the column.
- Sum: Sums the rows in the numeric column.
- Count Non Null: Returns the number of rows in the column, excluding nulls.
- Count Null: Returns the number of nulls in the column.
- Average: Returns the column average for a numeric column.
- Average, ignoring zeros: Returns the column average for a numeric column, excluding zero values.
- Min: Returns the numeric column's smallest value.
- Max: Returns the numeric column's largest value.
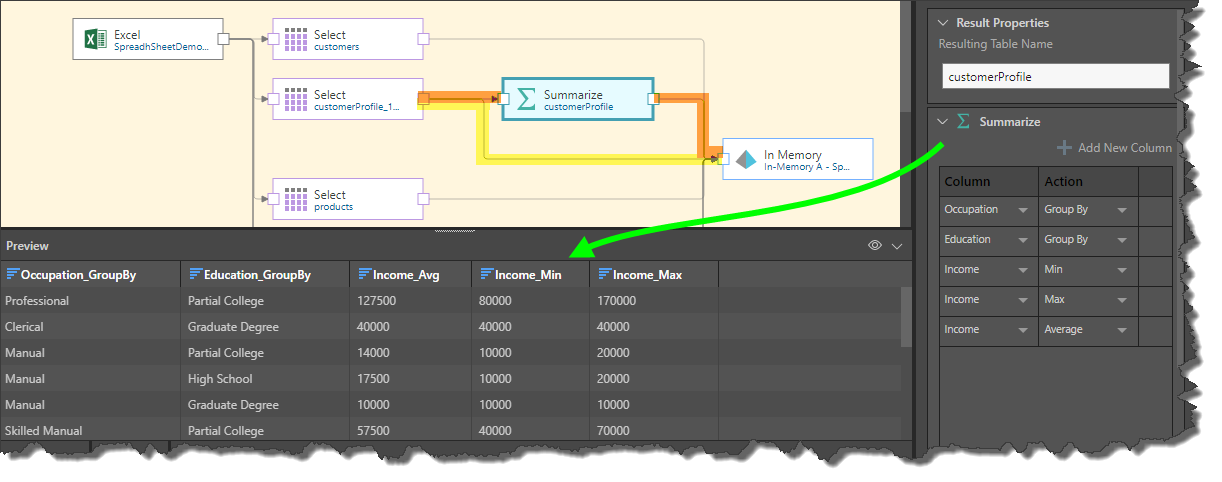
Join the Summarize Node
The Summarize node generates a new table which can then be joined to the original table. This can be done in Data Flow, using the Join nodes, or in Data Model. The Data Flow is the ETL toolset for Pyramid users; join operations added to the data flow are loaded into the target and stored in the database.
Data Model, on the other hand, is the semantic layer of logic that is used to describe the structure of the data model. Joins configured in Data Model are not added to the database schema, but are used only in the querying process.
In this example, the Summarize node was connected to the customerProfile table and used to generate columns displaying min, max, and average income by occupation and level of education (green arrow below).
The customerProfile table and the Summarize table were each connected to the target (yellow and orange highlights respectively), so that these two tables can be joined from Data Model.
Related information
Common Properties
There are a number of fields that are present in the Properties panel when you have any of the preceding nodes selected on the canvas. These fields include Result Properties, Column Selection, Set Variable Values, and Metadata.
- Click here for more details about the Common Properties