The context menus for both discoveries and presentations include a range of functions, allowing you to dynamically interact with visuals, perform further analysis on the fly, and discuss results with other users. You can access the context menu by right-clicking the data point you want to interact with.
Depending on the permissions granted to you by your Admin, and the settings configured by the report-builder, you may not have access to all of these functions. Report-builders can configure runtime settings in both Discover and Present to manage which interactions you will have access to.
Query Interactions
Pyramid provides many ways to interact with your data and queries on the fly enabling you to slice and dice, filter, sort, drill, and more, directly from the right-click context menu. The various query functions allow the user to change the way a query resolves a data set result (and its related visualization).
To access interactive query functions right click on the cells, columns, headers, legends or segments of the visual, or on the visual background.
Follow the links on this page to learn about each query interaction. Note that many of these links will take you to the associated topic in the Pro User help.
- Click here for more on making single and multi-element selections that can drive interactivity.
Discoveries
Functions
- Explain: Use AI to generate insights into the factors driving, or contributing to, a data point of interest from any analysis.
- Explain the Difference: Uses AI to generate insights into the factors driving two or more selected data points.
- Add, Remove, and Swap - Injecting, removing, and replacing hierarchies respectively. (These options are variations of Dice.)
- Dice - Dicing allows you to 'drill across' from a chosen element into another hierarchy.
- Drill Down, Drill Up, and Drill to Level - Move between different levels of a user hierarchy. Drill up or down to the next or previous level of the hierarchy, or drill to a specified level of the hierarchy.
- Expand and Collapse - Where expand icons (+ / -) are shown in a grid, you can use this option to hide and show multiple levels of the hierarchy.
- Member and Data Point Selection - Select elements and data points for analysis directly from the visuals.
- Quick Sort - Sort the data and items in your visual by descending, ascending, or custom values.
- Quick Filter - Filter the data and items in queries
- Pivot - Switch the discovery's x- and y-axes. (Rotate selections between drop zones in your query design.)
- Totals - Add "totaling" to grids to add context and information to the report.
- Show or hide Range Slider: Use the range slider to zoom in and out of Cartesian charts that contain a large amount of data.
Extended Interactive Functions
Beyond the core query interaction functions described above, the right-click context menus can also be used to drive extended capabilities that extend the data consumption and interrogation process - even if they do not all directly involve changing the current query. These functions include Calculation tools (which do change the query), Actions, Alerts and Conversations.
- Actions: Jump to another report or dashboard.
- Alerts: Attach a triggered event to notify users if a data point has changed (up, down, or the same).
- Workflows and Conversations: Add or reply to workflow threads with other users. Workflows and conversations are typically attached to data.
- Change Visual: Change the visualization type used for the data / underlying query. For example, use this option to change your grid of data into a line chart instead. See below for more information.
- Analyze Further: Open the discovery for further analysis in Discover Lite.
- Copy: Copy the raw data or visual data, or a given row, column, or data point.
- OData: Copy a URL or snippet to your clipboard that allows results to be read into another client's technology.
Change Visual
There are two sets of options on the Change Visual menu, both of which change the appearance of your visual for analytic purposes:
- The first submenu, Visual AI, offers a set of recommended visualization types generated for the current data by Pyramid using its AI-driven Smart Recommendation engine. Given your current data, this option suggests the most appropriate visualization types. For more information, see Smart Visualization Mechanics.
- The other submenus offer each of the visualization types for selection. You can select these options regardless of the current query data. For details of all available visualization types, see Discover Pro Toolbox.
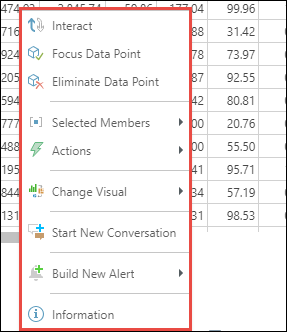
Presentations
Presentations support the capabilities listed above, as well as the following:
- Rate Item: Provide a rating out of five for the content item.
- Information: Open the Query Metadata panel to see query information, data source metadata, and report metadata.
- Interact: Apply cross-visual interactions from the selected visual to its target visuals.
- Multi-Highlight Mode: Enable selection of multiple member elements using standard single-clicking. If this option is not enabled, you need to use
Ctrl+Clickto select multiple items. - Bookmarks: Presentations. Save your current slicer selections against a "bookmark," so that you can apply the same selections again in future.
- Direct URL Link to Slide: capture a special URL that offers direct access to the current slide.