The "Pro" full client in Pyramid is made up of several modules, with each designed to address a specific business or functional need. While it's not uncommon to have access to all modules, it is possible that certain modules are no accessible to different users because of skill level, application security, or use case.
- See profiles for governing which modules or "apps" are available to which pro user.
Analytic Assembly Line: How Do the Modules Fit Together?
The modules in Pyramid take you all the way through the "analytic factory assembly line" - from data preparation, through to building data queries and data visualization with formulas, and finally, creating polished and sophisticated reports that can be presented and shared with colleagues either as interactive dashboards or high-quality, pixel perfect published documents.
Note: As mentioned, not all apps in Pyramid are required in every use case. The following explanation assumes that they are all used.
The Data Factory for Decisions
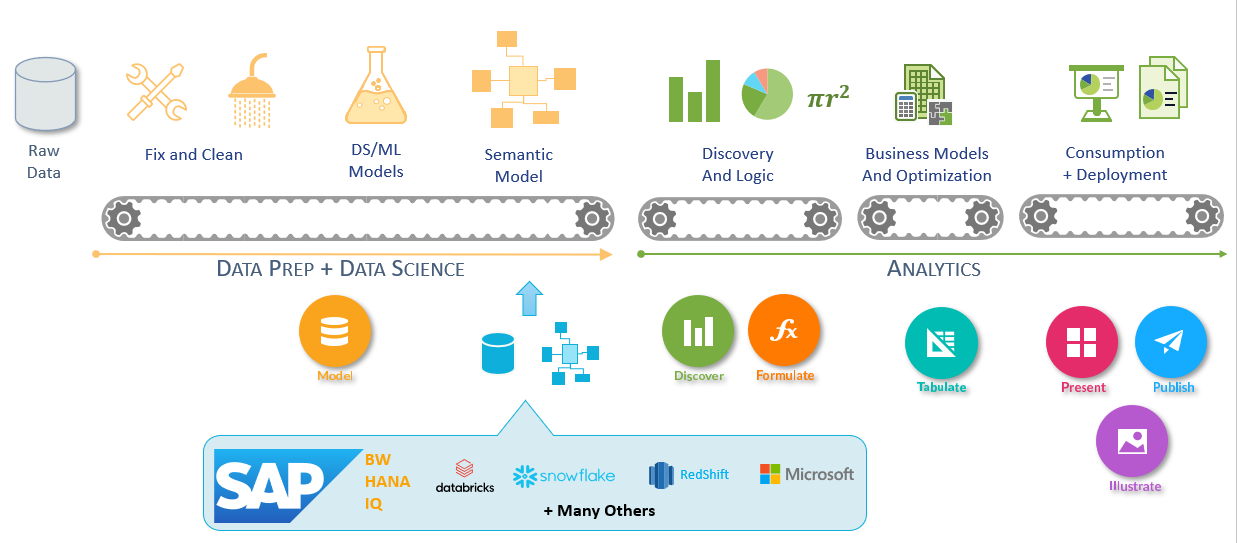
Model
Usually, the first step in any data analytics exercise is to prepare the data for analysis. In many organizations, this step has already been completed and a database, data model, OLAP cube or in-memory database has been pre-built for end users.
However, in the current era, end users are building their own data models and are preparing their own databases - even if they reuse existing data stacks prepared by others (like IT).
The data modeling app - Model - is designed for end users to achieve the necessary steps to prepare their data for analysis - starting from the basis that the data needs full preparation all the way to the other extreme, where no data preparation is required at all. In Model, you can connect to data sources, transform the data, and load it into a target. Then select which columns to import, define the joins, and build hierarchies.
Discover
Data discovery - using Discover - is where users can start using their data for analysis and visualization. It is the venue where users 'discover' information in their data through ad-hoc querying. Regardless of purpose users use Discover to build visuals and queries from scratch, and integrate custom calculations, scripts, or KPIs that have been configured in Formulate. So once the data model has been built (or presented), users can define custom queries and slicers in Discover.
Formulate
Formulate is a separate app for building more complex business logic through graphical, point-and-click tools. Here, users can define and build formulas, element lists (or sets), KPIs, Python and R Scripts, custom visualizations, and so on. All of which can be used in queries in Discover and the other apps.
Tabulate
Tabulate is an App within Pyramid that provides a spreadsheet interface to design and build business models and decision models. It provides a live connection to (multiple) data, enabling you to report and build models on data that can change dynamically. Existing Discoveries and spreadsheets can be added and then used to mesh and perform further manipulations on the data. Being a spreadsheet application, it provides you with the flexibility and functionality of similar applications (such as Excel).
Present and Publish
Finally, build dynamic slide presentations in Present, and create and share scheduled reports in Publish, based on the content built in the other modules. Present and Publish ensure that users have a huge amount of control over the look and feel of their content when it is consumed. Rather than simply exporting and sharing a dashboard or report, the user can import relevant visuals into the presentation or publication, and configure the appropriate filters and slicers for each component within the report.
So users typically take the reports and visualizations they created in Discover and place them into presentations or publications to drive access for themselves or other users.
Users can also design and build templates for cover and content pages, determine the layout of each page or slide, and incorporate text to guide the reader through the report. This can also include more sophisticated elements built with Illustrate.
Illustrate
More sophisticated use of data can be exposed through data driven images and texts built in Illustrate. These can then be added into presentations and publications to enhance (and often simplify) analytics by adding data-driven visual elements.
Embed
One avenue of content deployment is also through embedding content into other applications. This provides another mechanism for sharing analysis and discovery with users beyond the main application itself.
Storing and Managing Content
Each content item in Pyramid is saved as a separate element in the Content Management System (CMS). It is the means through which users can store their items but also share their content with other users on the system. The CMS also provides control of content organization, access, lifecycle, as well as peripheral functions like structural analysis, content lineage, and versioning.
Application Access and Security
Binding the application together is a comprehensive user-role based security model that governs access to functionality, content and then data. Click here for a better understanding of how these pieces fit together in the pro client and beyond.