The Discover Lite workspace is a highly simplified experience from the Discover Pro tools yet still offers some powerful and flexible options for reporting and querying of data.
Workspace
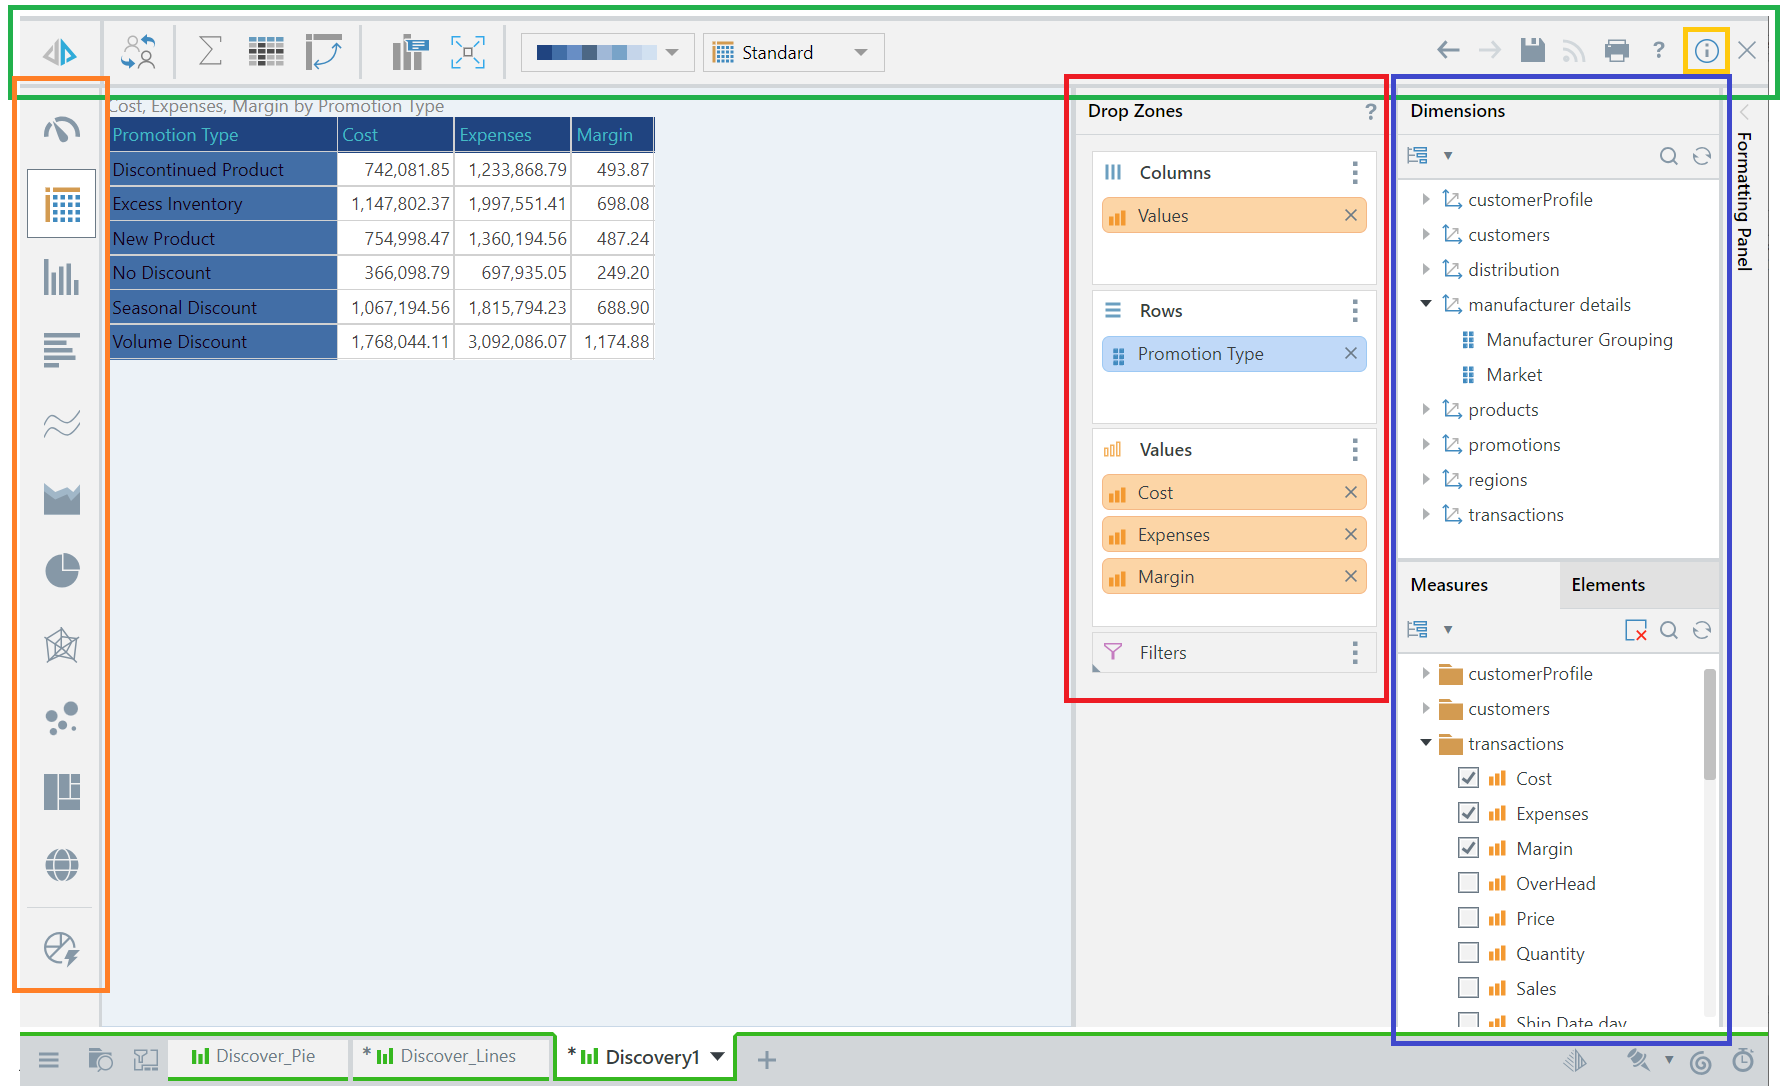
The workspace includes:
- An overhead ribbon (green box below)
- A simplified toolbox (orange box below)
- Simplified drop zones (yellow box below)
- Hierarchy, Measure, and Element Trees (blue box below)
- App Tabs and App Tab Menus (purple box below)
Discover Lite Ribbon
The Discover Lite ribbon appears along the top of the canvas, and it changes according to the selected visual type and the query components. The menu displays a few key functions from Discover Pro, to assist in analyzing the query. Click here for details about these functions.
Status Bar
The status bar options to the right of the ribbon allow you to: undo and redo actions, save, subscribe (for discoveries, tabulations, and publications), and share your discovery.
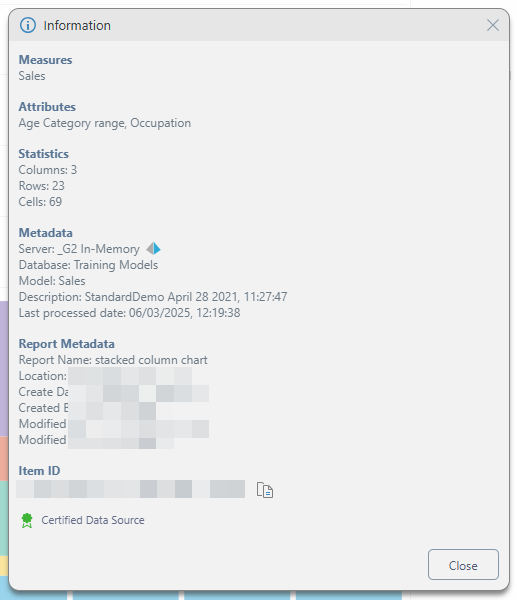
Information
 Click the 'i' to the right of the ribbon (yellow arrow, above) to display the report details including the server, database, and model path:
Toolbox (Visualization Picker)
Users can change the query's visualization from the visuals toolbox by selecting a visual category. From the submenu, choose the required visual. For more information, see Discover Lite Toolbox.
Drop Zones and Trees
On the right side of the canvas, you'll find the two panels that allow you to build your visual:
- Trees of Dimensions, Measures, and Elements panels that you want to add to your visual (orange highlight).
- Drop Zones (green highlight) that you will drop your metadata into from the trees.
Note: To build your query, you must add hierarchies and elements and measures to the drop zones.
Drop Zones
Hierarchies reside within the dimensions; open the required dimension, find the relevant hierarchy, and drag it onto the drop zones. To add only specific elements within a hierarchy, right click on the hierarchy from the Dimensions panel and select View Elements. Select the required elements either manually or using the Members Search.
To add values to the query, find the required measures in the Measures panel and add them to the Values drop zone.
You can add existing business logic from the Measures and Elements panel.
Trees
The tree panels show the data models metadata (Dimensions, Measures, and Elements panels) in a tree format. Select the data that you want to include in the query from these trees.
There are three trees:
- Dimensions: The model's tables (called dimensions); each dimension can be expanded to show the hierarchies within it.
- Elements: The attributes (called elements) inside of a selected hierarchy.
- Measures: The quantitative data (measures) in the model.
App Tabs
When you have content items (discoveries, publications, and so on) open in Pyramid, each is shown on a tab in the App Tab menu along the bottom of the page. You can move between the content items using these tabs and also open each App Tab's context menu from the arrow shown on the tab. For more information, see App Tabs Menus in Discover Lite.