Pyramid presentations are "slide shows" where you explain the story of your data to other users (perhaps your manager or colleagues) in an arresting and graphical manner. To convey your story, you might break up the different information across different slides, and add different content items (visuals, slicers, text, and so on) to those slides that communicate, say, sales data, the effect of promotions, and so on.
This topic describes how to add various content items to your presentation; from visuals created in Discover to headings and images that provide supplementary information. For information about how to format those content items (and the slides more generally) once they are included, see Formatting and design in Present Lite.
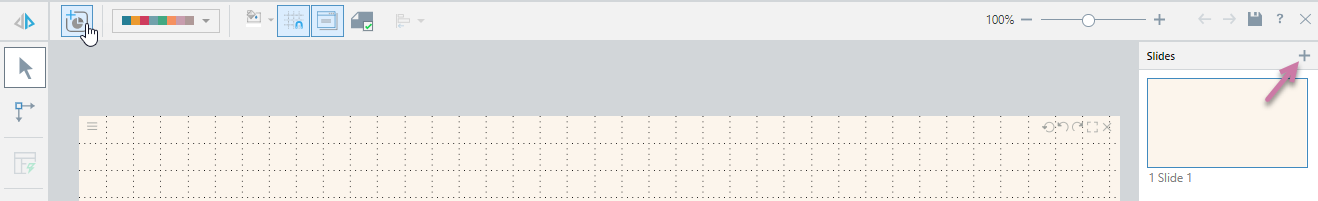
Adding slides
You can add new slides to your presentation from the overhead ribbon, from the slides panel (purple arrow), and using the right-click context menu with your cursor in the Slides panel:
- Click here for more information about the Present Lite ribbon
- Click here for more information about the Slides panel
Note: When you add a slide, it is typically added after the last slide in your Slides panel (at the end of your presentation). You can change its position in the overall presentation using drag and drop.
Adding content items
You typically add content items to your presentation by dragging them from the toolbox onto the canvas of your selected slide. For some content items, such as slicers or new visuals, you need to open tools and specify additional details. For others, such as text fields, static images, or tables of contents, you can just drag and drop.
Adding existing visuals
You can add visuals from Discover or visual areas from Tabulate to your presentation if they have been saved to the content management system in a location you can access. This re-use ensures that you are always including the latest underlying analytic data from your team in your presentation.
- For more information, see Adding Existing Visuals in Present Lite
Creating and embedding new visuals
You can create a new visual and embed it directly into your presentation, either using Smart Reporting or Discover Lite. These are both easy-to-use design-time tools, but whereas Smart Reporting does most of the work of creating your visual for you, Discover Lite provides access to more functionality to let you customize your visual to your own requirements. Once your visual is built, clicking Finish embeds it into the presentation.
Tip: Don't worry about choosing "the wrong" option. Once you have created your visual using either of these tools, you can open it up in Discover from the right-click menu to edit it at any time.
Smart Reporting
Smart reporting provides a highly simplified, wizard-like process for building visuals that are then saved and embedded within your presentation. Smart Reporting is a good solution for those users who want to build their visuals quickly and want to allow the wizard to design the visual (selecting the appropriate visualization type, for example) on their behalf.
- For more information, see Creating Visuals using Smart Reporting in Present Lite
Discover Lite
Discover Lite offers a streamlined interface and a slimmed-down range of Discover functionality but offers more flexibility and complexity than Smart Reporting. It is a "happy medium" between the full Discover Pro experience and the simplified Smart Reporting experience. Discover Lite is a good solution for those users who want to retain close control of the editing functions available for building their visuals.
- For more information, see Creating Visuals using Discover Lite (Present Lite)
Adding slicers
You can add slicers to your presentation (dropdown lists and so on) that highlight or filter the other content items at runtime. For example, a slicer may be a dropdown list that allows your end user to select, say, a product that they are interested in at runtime. Selecting this option from the slicer filters the other visuals or data on the slide to only show information about that selected product.
- For more information, see Creating Slicers in Present Lite
Adding text elements
You can add static and variable text to your presentation by either adding a textbox and then typing free static text into it or by adding a variable text field that will be replaced dynamically at runtime. This functionality is typically used to add titles, headers, or explanatory notes to your presentation.
- For more information, see Adding Static and Variable Text in Present Lite
Adding a table of contents
You can add a table of contents to your slide that describes all of the sections and slides in the presentation. When the presentation is viewed at runtime, you can use the slide names in the table of contents as links to go directly to the selected slide.
- For more information, see Adding a Table of Contents in Present Lite
Adding shapes and images
You can import saved images from a folder location. This is a convenient way to add branding, such as icons, banners, and mission statements, to your presentation. You can also add shapes (warning symbols, squares, and so on) from the preset selection
- For more information, see Adding Shapes or Images in Present Lite