Learn how to build and publish pixel-perfect reports, as a user of Publish Lite. This example end-to-end process adds visuals and slicers to a new publication and explores how you can professionalize your data layout using design tools.
Note: This content guides you through the simplest end-to-end version of creating and saving a publication to get you familiar with the overall process. For more detailed guidance, see Building Publications using Publish Lite.
Before you begin
This walkthrough assumes that you are a Publish Lite user. If Publish Pro opens, then you should follow the Publish Pro walkthrough instead.
- Click here for the Publish Pro walkthrough
End-to-end process
Step 1: Create a new publication
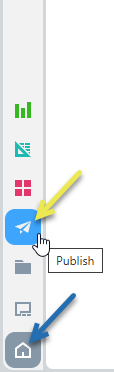
From the App Toolbox on the Pyramid home page:
- Click New Publication (yellow arrow).
- To create a publication with the default settings, just click Portrait to indicate that you want your publication to have a vertical layout.
The New Publication launcher opens.
A new publication is created.
More information
This step provided the simplest entry point that you can use to create a new publication in Publish Lite. If you want to learn more about this process and about the other options that you may select when creating a publication, see the following topic:
- To learn more about building publications, see Building a New Publication in Publish Lite
Step 2: Change your theme and add a cover
The publication that you just created uses the default Theme to define colors, fonts, styling for visuals, and even add some common graphics, text, and so on to all the pages in your publication using the "master pages." This step is going to change the Theme and create a new front page or "cover" for this publication.
From the overhead ribbon:
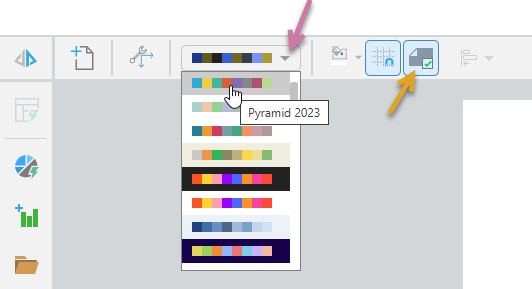
- Select a theme from the Theme dropdown list (purple arrow above). We recommend changing to a very different theme for your default, so if your default is to use the light theme, why not select the Dark version?
For each item:
- The dropdown list displays each theme's color scheme, including the main background color for the pages as the background for each row.
- The theme dictates the fonts, headings, color of visuals and backgrounds, and other formatting parameters.
If your Theme includes a cover, it is selected automatically (orange arrow). This means that Page 1 in your publication is updated to use the Cover Master. Most publication covers include some additional background images and layout details that make it different to any of the other pages in the publication.
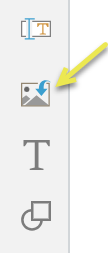
- Add a Corporate Logo to your cover:
- From the Toolbox, click the Import Image option (yellow arrow, below) and navigate to an image on your local machine.
- Optionally, move your image to an appropriate position on the canvas:
- Re-size the image using the handles that are visible at its corners and edges when it is selected.
- Reposition the image by dragging it to a better position.
Your image is added to the canvas in a "selected" state.
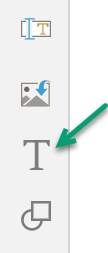
- Add a Title for your publication:
- Click Text (green arrow).
- Click the canvas at the point where you would like to add your company name.
- Add your company name and re-size and reposition the text box by selecting it and grabbing its handles.
- Update the style used for your title:
- If your output publication is a PDF and you want to add Bookmarks.
- If you add a Table of Contents.
A text box is added to the page at the selected point.
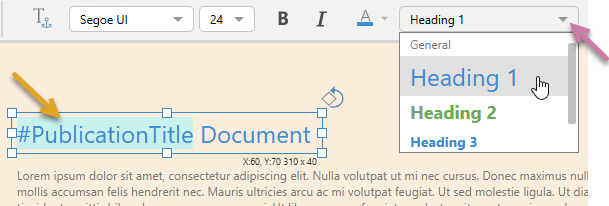
You should use the Heading 1 Style for your title:
Your basic cover is created. You might want to add extra content here, such as a copyright notice or the names of authors, a publication date (perhaps using dynamic text fields, so these are variable values), and so on.
More information
The purpose of this step was to demonstrate that you can change some options in Publish Lite to create a cover, to add some styled text, and to add an image. There are lots of other styling and formatting options available to you. For more information about these options, see the following topic:
- To learn more about covers, themes, and styling, see Formatting and Design in Publish Lite
Step 3: Add a one-off visual
Now that you have created your cover, you can add a new page and place a new visual on that page. You will create the visual, showing Sales by Promotion Type as a Pie Chart using Smart Present.
Important: This is probably the most important stage of creating your publication; adding some analytic content that you want to share with your audience. In this case, you will create a one-off visual that only exists within this publication and cannot be reused by other users or in other publications using Smart Present. You could, alternatively, add shared visuals from the content manager. For more information about these options, see Adding Content Items in Publish Lite.
- Add a second page to your publication, by selecting New Page on the ribbon or in the Pages panel.
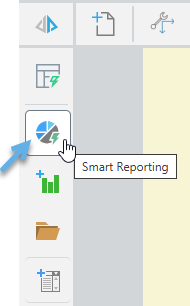
- From the Toolbox, click Smart Reporting.
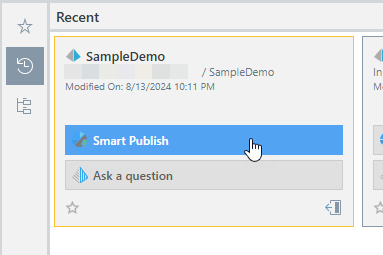
- In the Smart Reporting page, navigate to the demo model and select the Smart Publish option:
- For each of the measures or dimensions that you want to add to your visual:
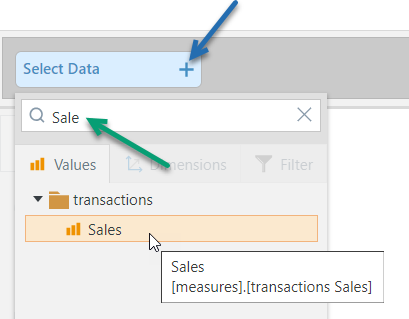
- Click the Select Data + button (blue arrow) to open the data selection panel.
- Click the Visuals tab, and select Sales as the measure you are interested in.
- Repeat to add more measures (Values), Dimensions, or Filters.
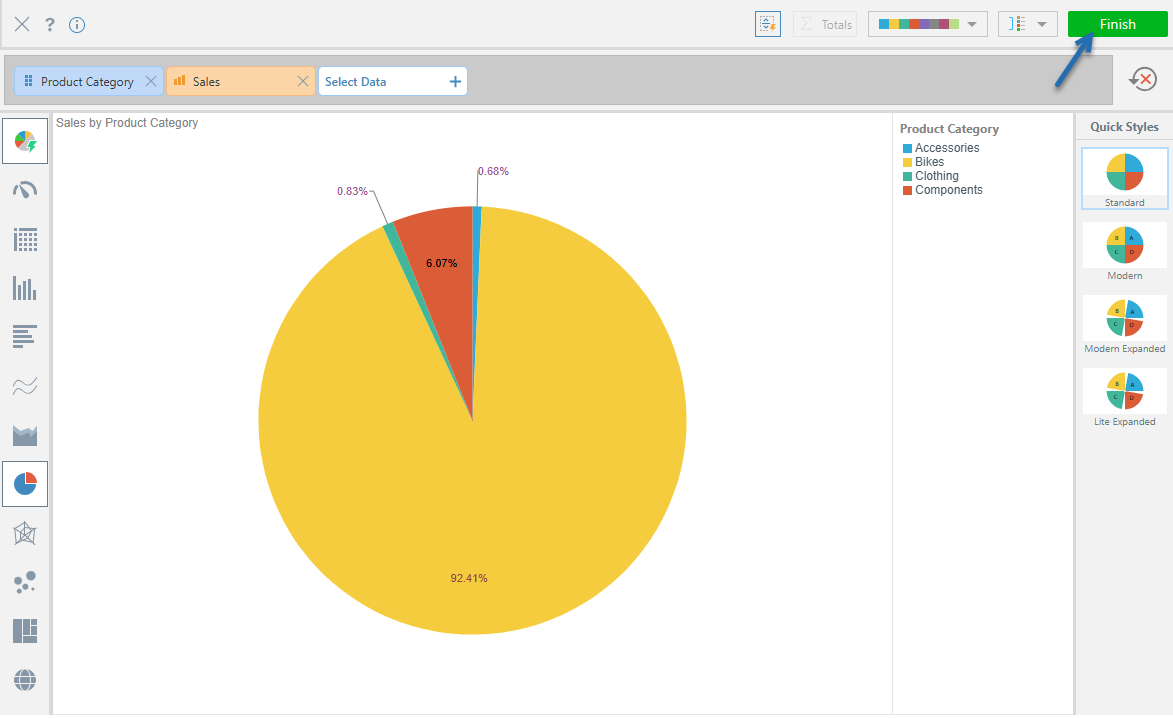
- Click Finish (blue arrow below) to save your changes and drop your new visual into your publication:

Note: The new page may have a very different appearance to the first page you added. If this is the case, it is because it is a content page and not a cover page. Your publication can only have one cover page.
Either use the search field to filter the options by name, or navigate through the tree to your option. Selecting an option adds it to the visual. Note: You can only select a filter or dimension after you have added at least one measure.
Note that, as you add Values, Dimensions, and Filters, your data is visualized automatically using Auto Recommend. With Sales selected from the Values tab, and Product Category selected from the Dimensions tab, Smart Publish builds a simple Pie Chart.
It is important to note that your new visual only exists inside this publication. If you want to share it with other users, you need to use the Open in Discover option on the right-click context menu to open it in Discover Lite and save it in a shared location in the content management system.
More information
The purpose of this step was to demonstrate adding some analytic content to your page for your reader. There are lots of different types of content items that you can add to your pages, from visuals and images to text. For more information about these options, see the following topic:
- To learn more about creating and adding content, see Adding Content Items in Publish Lite
Step 4: Add a slicer and interaction
Now that you have created a new visual, you should create a slicer that allows you to build a document in which the visual information is filtered to reflect the purpose of the document. Since the pie created in the last step showed Sales by Product Category, a useful slicer might allow us to see the sales in different Countries.
- From the Toolbox, click the New Slicer option.
- Select the Model and Data that you want to use.
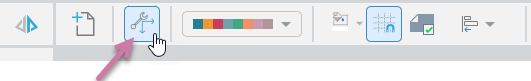
- From the Ribbon, click Interaction Manager.
- Select the checkbox between your slicer and visual:
The New Slicer panel opens.
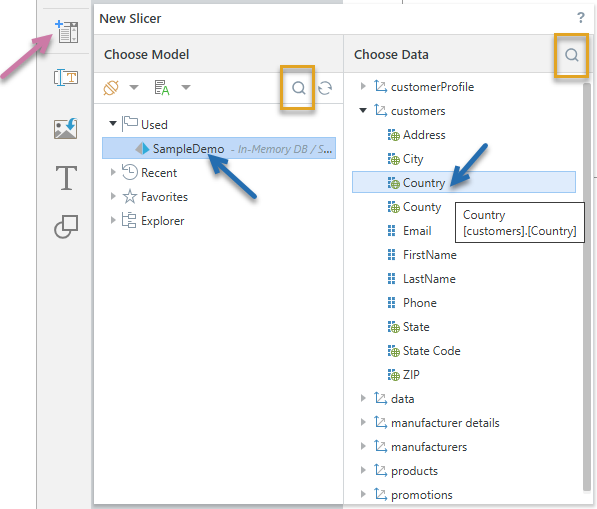
This example shows that the model used in this publication already is selected and the slicer will include the customer's Country. Tip: You could use the search facility (orange highlights) to find your model and data if you know the names of your items.
The Interaction Manager panel opens at the bottom of the page.
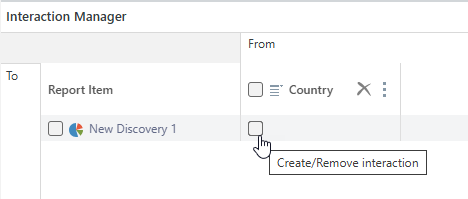
This indicates that changes to your slicer will affect the content of your pie chart. Since this is a publication, you can only select different options from your slicer at build time.
More information
The purpose of this step was to demonstrate adding a very simple slicer in your publication. When we build the publication, we will select a Country to build the publication for.
- For more information about interactions, see Interaction Manager in Publish Lite.
Step 5: Build, review, and modify your output
As you edit your publication, you should regularly view your changes by manually building your document in an appropriate format:
Open the Print & Export dialog
To open the Print & Export dialog, do one of the following:
- Click Run (top-left) or press F2 on your keyboard.
- Click Print from the Status bar (top-right, above the canvas).
- Type
printinto the Chatbot and press Enter.
Export the Publication
To configure your print:
- From the Output tab, select the document format you want and any settings associated with that format:
- Click the Slicers tab and choose the values you want your slicers to take in the published document.
- Click Export.
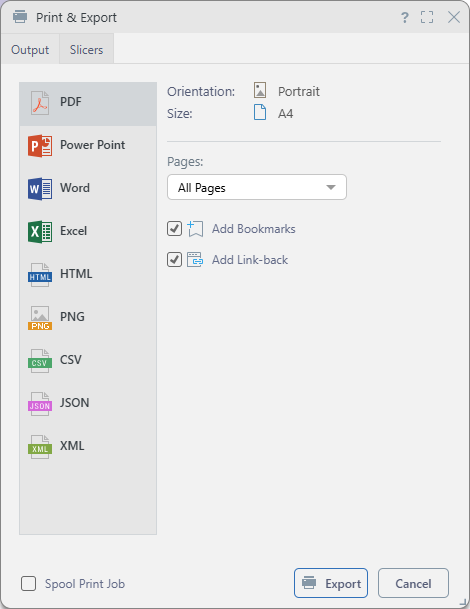
Tip: You should select the typical output for your publication when it is distributed, we recommend building a PDF in the first instance.
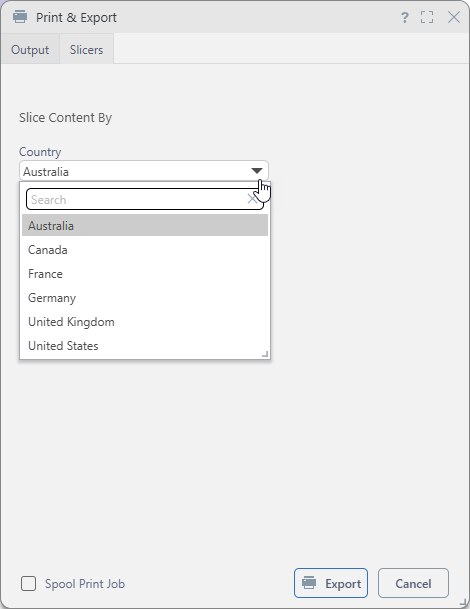
Note: Depending on the publication design, slicers can be date pickers, dropdown lists, or trees, and may allow single or multiple selections. Where multiple slices are selected, any affected content items reflect the combined data for all selections. For example, choosing three countries from a multi-select dropdown list displays data for all three in the visual.
Pyramid builds the publication in the format selected and with the settings specified for the format type and slicers.
In the example case, a PDF will be built and (typically) written to your downloads area. The visual it contains will be filtered by the selected Country.
More information
Once your initial publication is created, you can modify it by:
- Adding, removing, or adjusting content items, such as text fields, existing visuals or visual areas, and so on, to suit your requirements: Adding Content Items in Publish Lite.
- Formatting and applying design features to your pages or overall publication: Formatting and Design in Publish Lite.
Step 6: Save the publication
Save your publication to your My Content folder by clicking Save in the status bar at the top-right of your canvas:
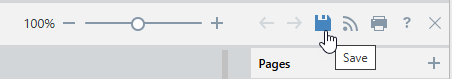
This saves your publication locally.
More information
This step describes how to save your publication locally. If you want other members of your team to be able to use or edit your publication, and you have sufficient access rights to do so, you should save it to your workspace or public folders.
- To learn more, see Save and share publications
Alternative processes
To learn how to build a publication either using AI or in the Publish Pro app: