The Present Pro toolbox, to the left-hand side of the canvas, lets you access key functions when building your presentation. These functions mostly let you add content items to the presentation, creating slicers, adding text, and even building new visuals on the fly. You will use these options when building the content for each of your slides.
- For more general information about the workspace, see Present Pro Workspace
Toolbox options
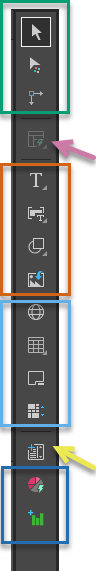
Selection / Interactions
The selection options (green highlight) control what your cursor does when you select items on the canvas.
|
Function |
Description |
|---|---|
|
The default selector option. When this option is selected, clicking an item on the canvas selects it. |
|
|
Format selected items on the canvas. When this option is selected, the canvas transforms into an intuitive, point-and-click formatting area. Hover your cursor over the content items on the canvas to highlight them for selection; then, once selected, make your changes from the Formatting panel. |
|
|
Show and manage interactions associated with selected content items. When this option is selected, clicking an item on the canvas displays the interactions to or from that item, and lets you create an interaction by dragging to the target item. |
Auto layout
|
Function |
Description |
|---|---|
|
Auto Layout (purple arrow) |
Use AI to rearrange the content items on your canvas according to one of the preset auto layout templates. Clicking the Auto Layout button opens the submenu that contains the preset layout options for selection. |
Basic items
The basic options (brown highlight) let you add text (including variable text), images, and shapes to your presentation.
|
Function |
Description |
|---|---|
|
Add a variable text field to your presentation that is replaced at runtime with a publication date, the slide name or number, tables of contents, AI-generated Slide Insights, or other values. Clicking this button opens the text field submenu, containing the options for selection. Select an option and click on the canvas to add a text box containing the variable tag to the slide. The tag is replaced at runtime with values from your presentation, your model, or generated by Pyramid using the underlying LLM. |
|
|
Import saved images and add them to the canvas. Tip: This can help you to achieve the appropriate branding. |
|
|
Add static text to your canvas. Tip: You may want to add fixed titles and descriptions or notes to help your readers understand their visuals. |
|
|
Add shapes to your canvas. Note: You can choose "shape presets" (that is, standard shapes that you can add to your canvas). Once added, you can customize their borders and fill colors as needed. |
Layout containers
The layout container options (pale blue highlight) allow you to add multiple content items to your slide within a "container." For example, allowing you to add a container with three visuals, each of which is accessed at runtime using the tabs.
|
Function |
Descriptions |
|---|---|
|
Users can add a web content panel to slides to blend Pyramid's analytical output with 3rd party web site pages and applications. The content can work interactively with Pyramid functionality, to make it dynamically change and respond to user interactions on in the dashboard. This function also lets users access the analytic catalogs of Tableau and Power BI to facilitate the embedding of their external analytic content alongside Pyramid content. Importantly, users can build interactions between the elements and Pyramid so that they can dynamically change both Pyramid and the external content using the same slicer or interactive functionality. |
|
|
Add a table that displays visuals, dynamic images, text, slicers, buttons, images, and so on in one view. This feature is commonly used to create KPI scorecards or to compare details; for example, sales details for each of the last three months. |
|
|
Add a tabbed panel that displays multiple visuals and other assets on separate tabs that your users can navigate between at runtime. Using a tabbed layout allows each asset to use the full real estate of the available panel. |
|
|
Add a scrollable panel that displays multiple content items on a single slide at runtime. Using a scrollable layout allows your user to view more items in one space than you have real estate to accommodate; they simply scroll to see more of the assets in the scrollable panel. |
Slicers
|
Function |
Description |
|---|---|
|
Add New Slicer (yellow arrow) |
Build a new slicer on the fly and add it to your presentation. A slicer added in this way is a basic slicer, where only the model and elements are selected on creation. To create an advanced slicer, where you can select default options, slicer limits, and so on, you can either use the Advanced Slicer option in the presentation ribbon or you can create a basic slicer and then edit its details from the right-click Slicer Settings menu. |
Content items
The Add content item options (dark blue highlight) are used to create visuals on the fly and add them to this presentation.
|
Function |
Description |
|---|---|
|
Build a one-off visual on the fly and embed that visual into your current presentation. The Smart Reporting tool offers you the quickest and simplest method of creating a visual; you select data, and the tool decides what type of visualization (pie chart, grid, and so on) to create on your behalf. Once created, you can edit some of the formatting associated with the visual, including the visualization type. |
|
|
Build a one-off visual on the fly and embed that visual into your current presentation. In this case, the tool used is a Lite version of Discover. This provides more technical users with a more powerful tool to build and format visuals on the fly. |
Note: In Present Pro, you can add existing visuals and visual areas to your presentation from the Content panel. For more information, see Adding Existing Visuals in Present Pro. Content items